The Fed has officially begun cutting rates
Nationwide Data Nick Granoski September 18, 2025
Nationwide Data Nick Granoski September 18, 2025
Note: You can find the charts & graphs for the Big Story at the end of the following section.
*National Association of REALTORS® data is released two months behind, so we estimate the most recent month’s data when possible and appropriate.
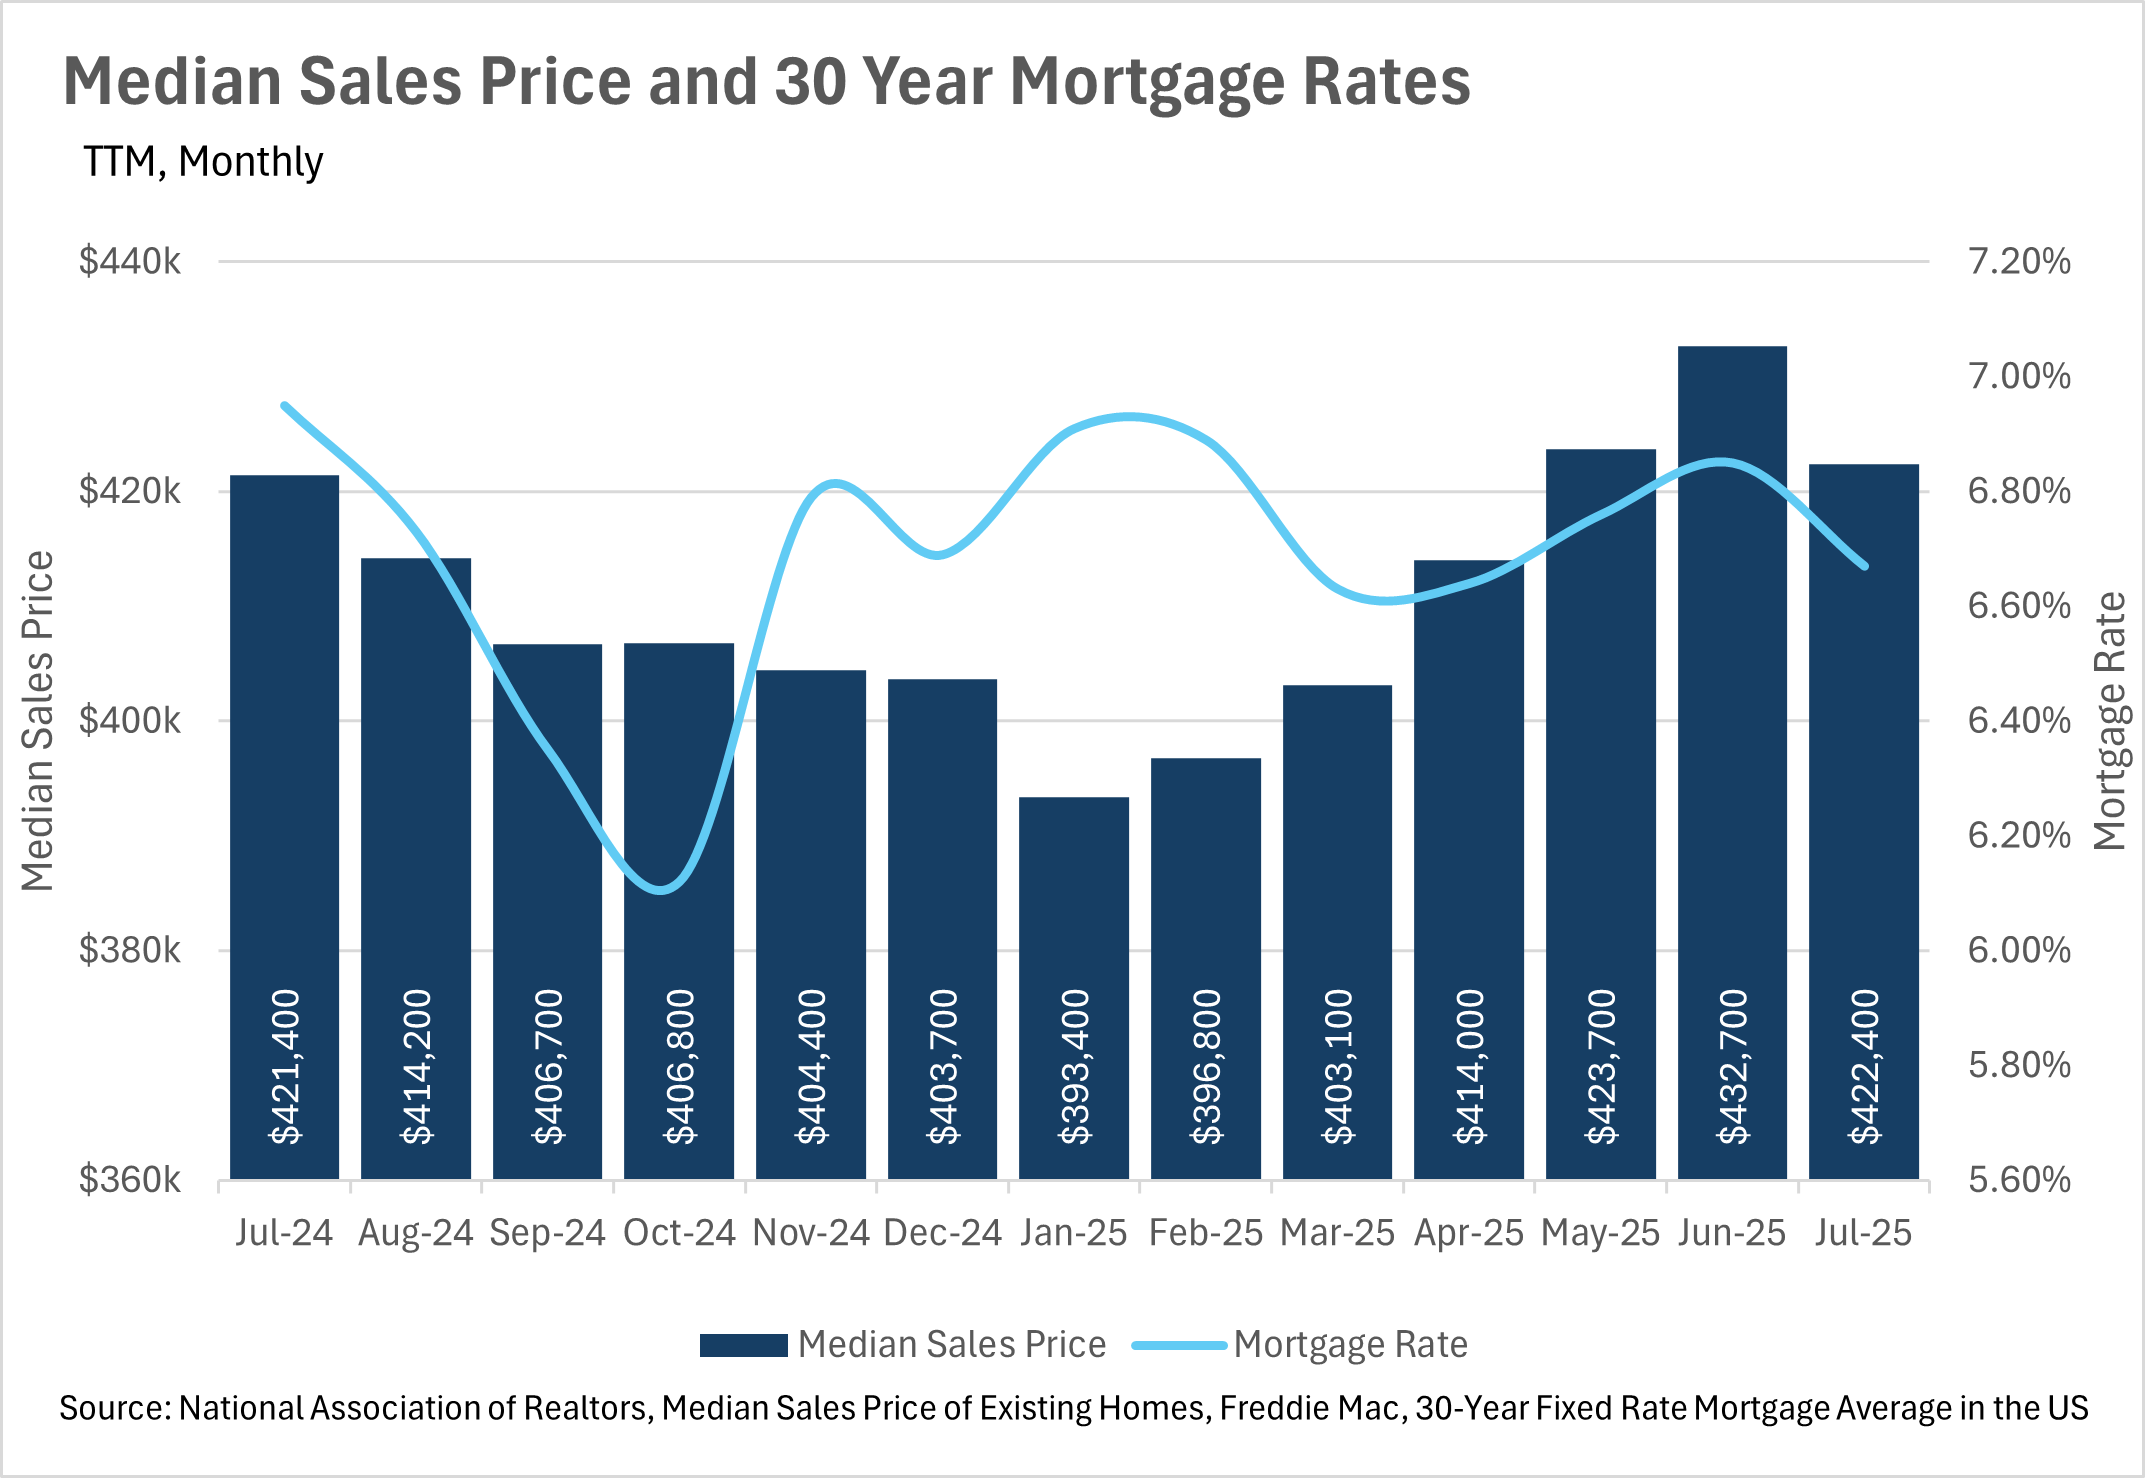
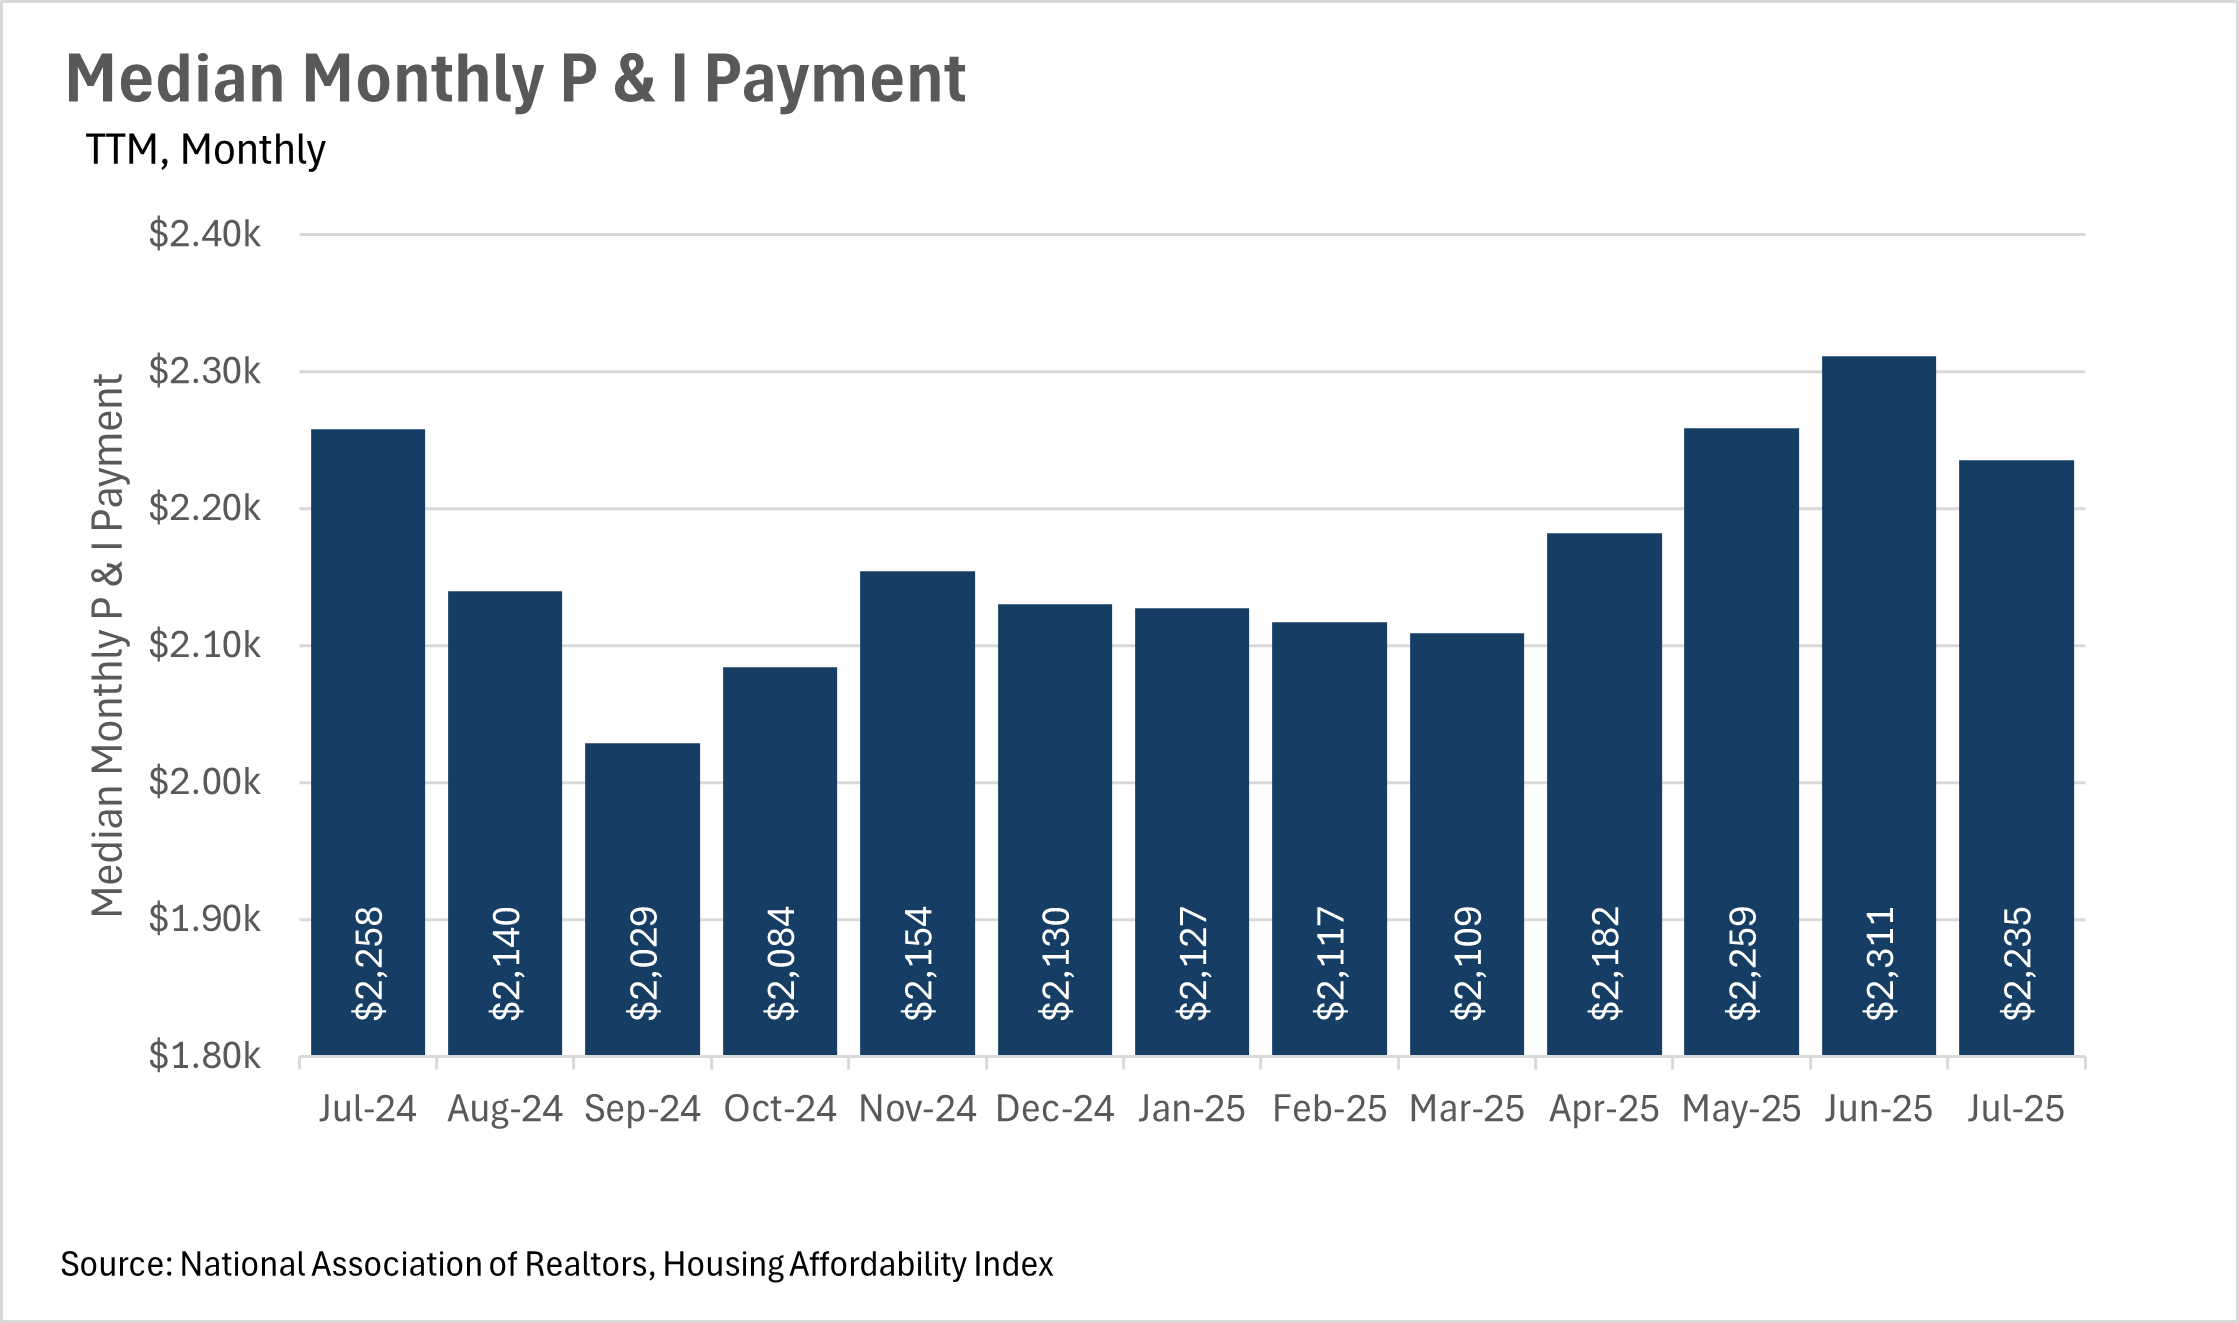
At $2,235 per month in principal and interest payments for the median homeowner, housing costs are near the highest points we’ve seen in the last year. As we all know, this is driven primarily by the fact that interest rates have remained high for quite some time, and home prices have not fallen by much over the past few years. However, existing homeowners might be able to save some money in the coming years/months, as Federal Reserve Chairman Jerome Powell mentioned in his speech at Jackson Hole that the Fed is keen on cutting rates in the near term. This, of course, would translate into lower P&I payments for new and existing homeowners alike.
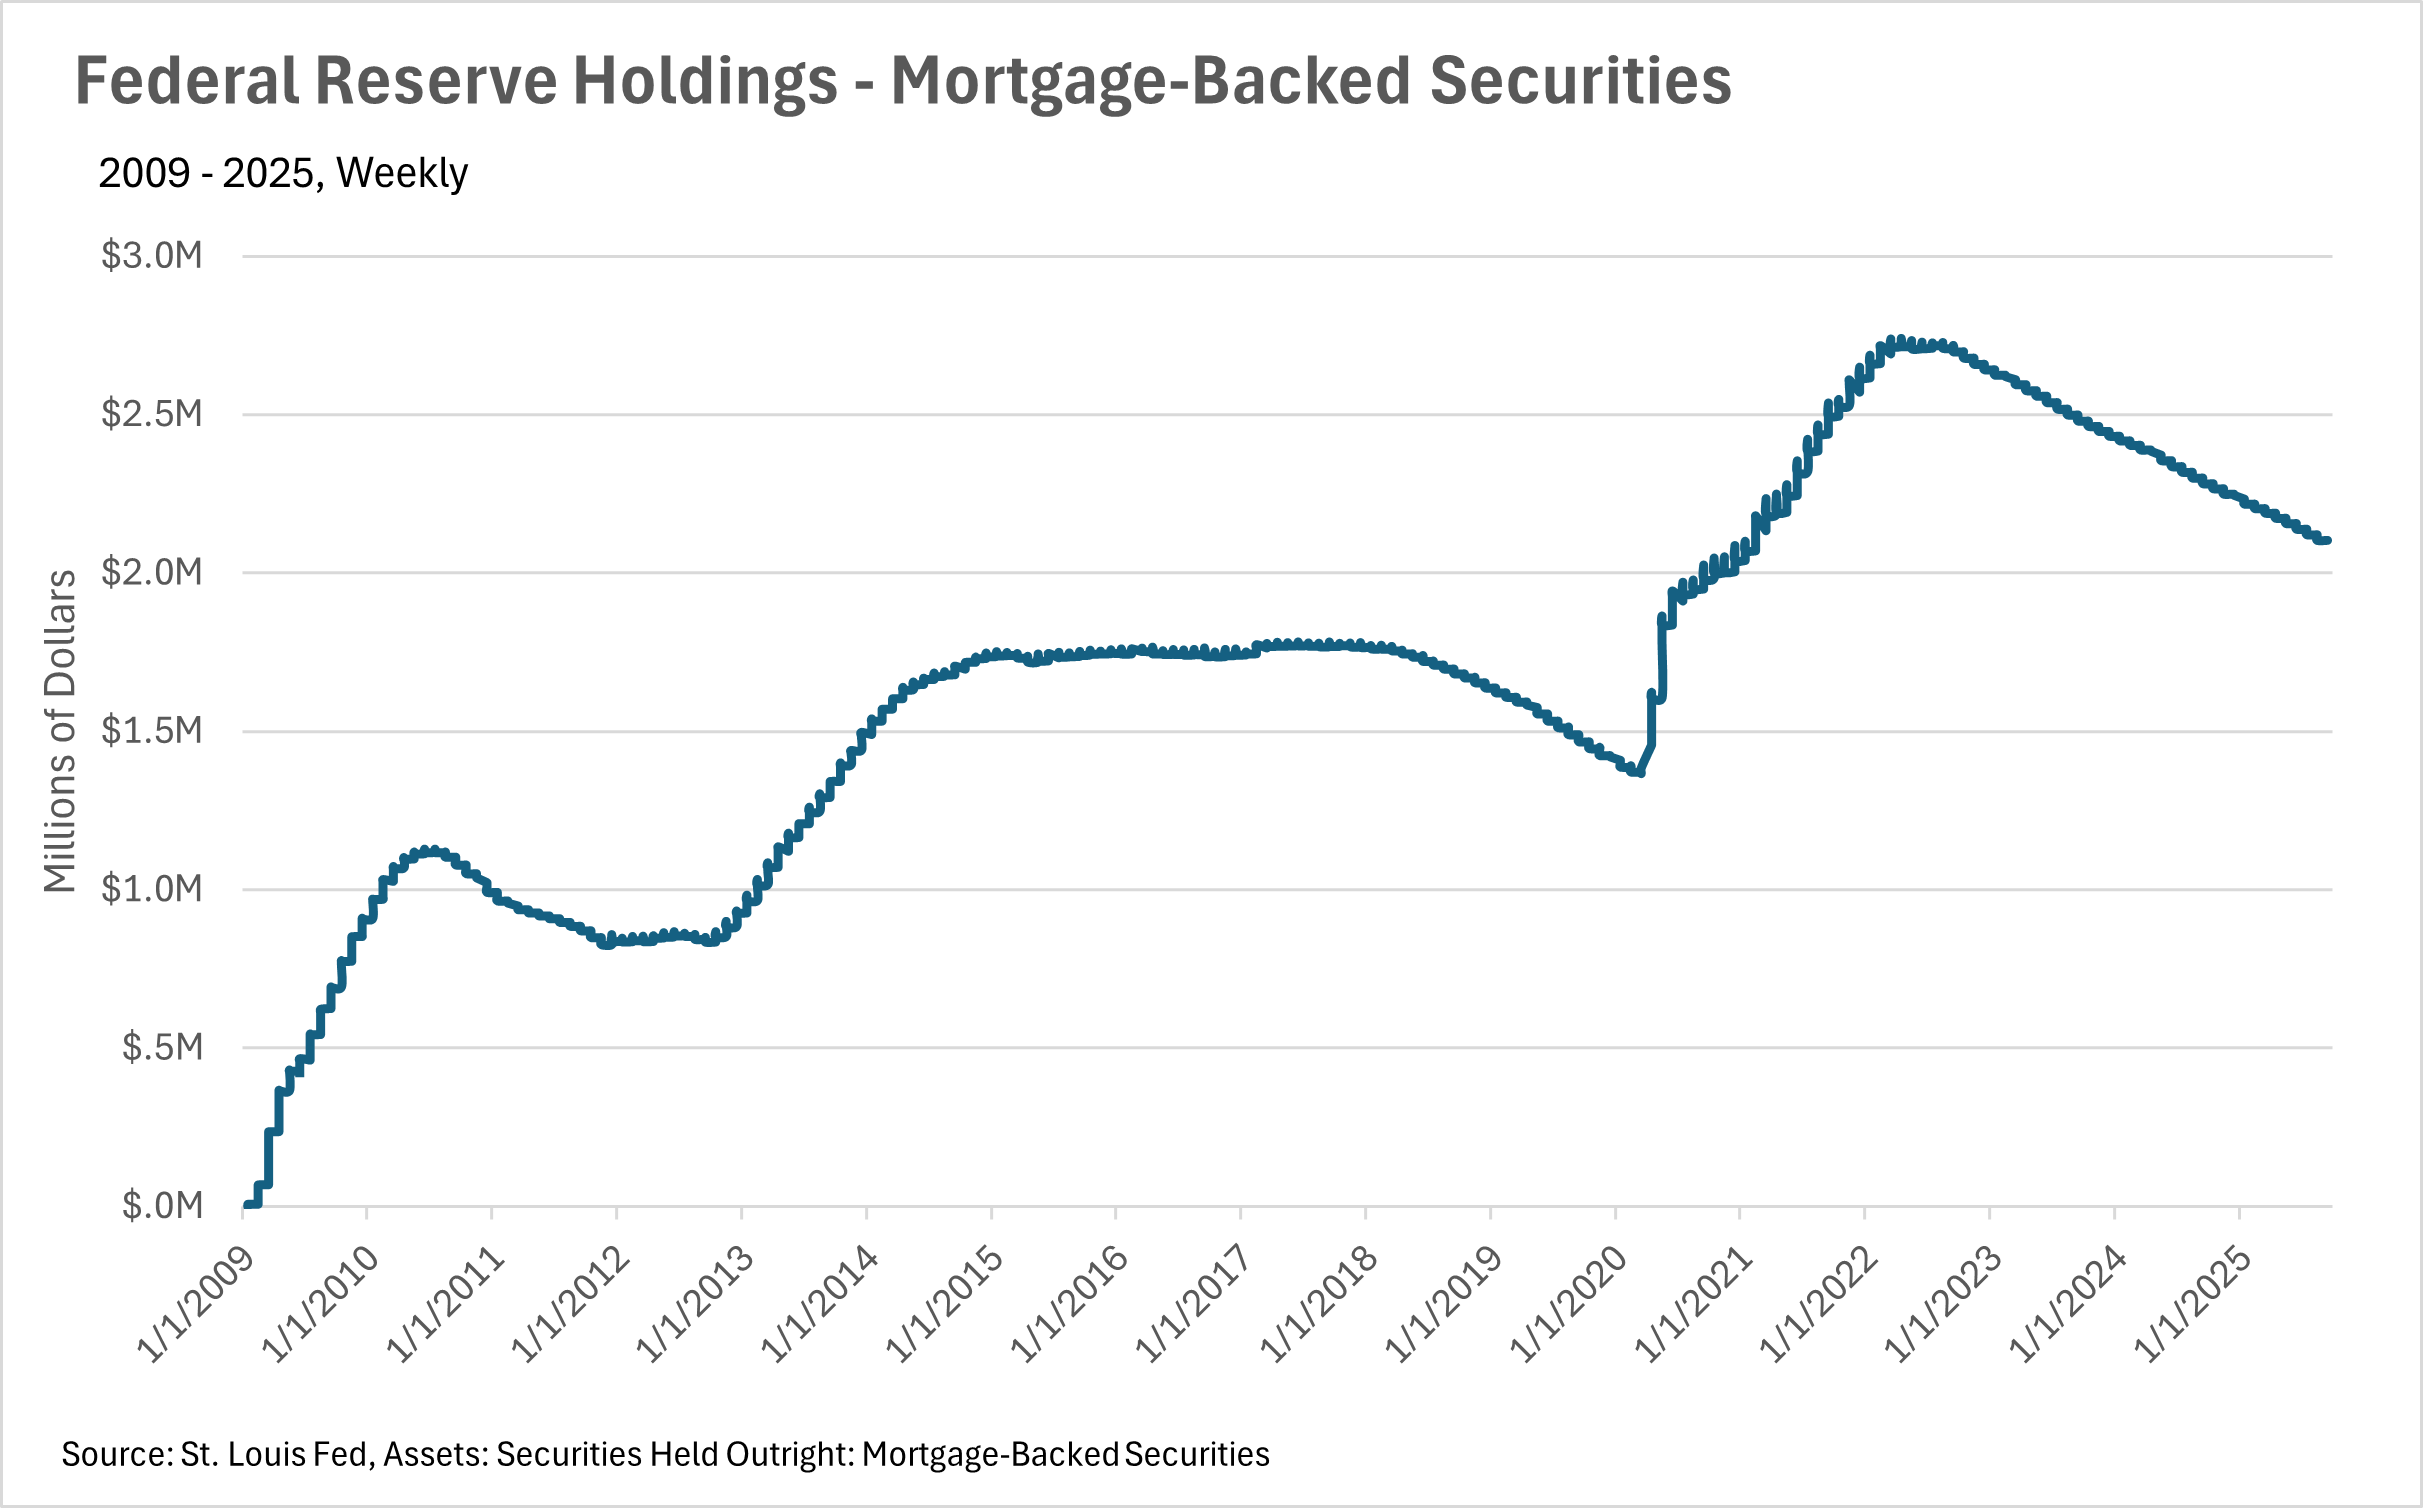
This week, the Federal Reserve lowered the federal funds rate by a quarter point — its first cut since December 2024. While the move was widely expected, it officially signals the beginning of what many anticipate will be a rate-cutting cycle over the coming months. For a housing market that’s been largely stagnant, this is welcome news.
For prospective buyers, this shift could create a window of opportunity. If real estate values react the way they did during the last period of significant rate cuts, prices could rise again as demand strengthens. That means buyers who act sooner may be able to secure a home before competition increases — and potentially refinance later if rates fall further.
Following the Fed’s decision, mortgage rates fell again this week. The average 30-year fixed mortgage rate now sits at 6.26%, down from 6.35% last week and the lowest level in nearly a year, according to Freddie Mac. Refinance activity has already surged, with nearly 60% of applications now tied to refinancing.
Looking ahead, economists expect the Fed to deliver at least two more quarter-point cuts before year-end. If that happens, we could see mortgage rates dip closer to the 6% mark — a level that would meaningfully improve affordability for buyers. As always, the Fed will weigh inflation and employment data in its decisions, so those remain the key indicators to watch.
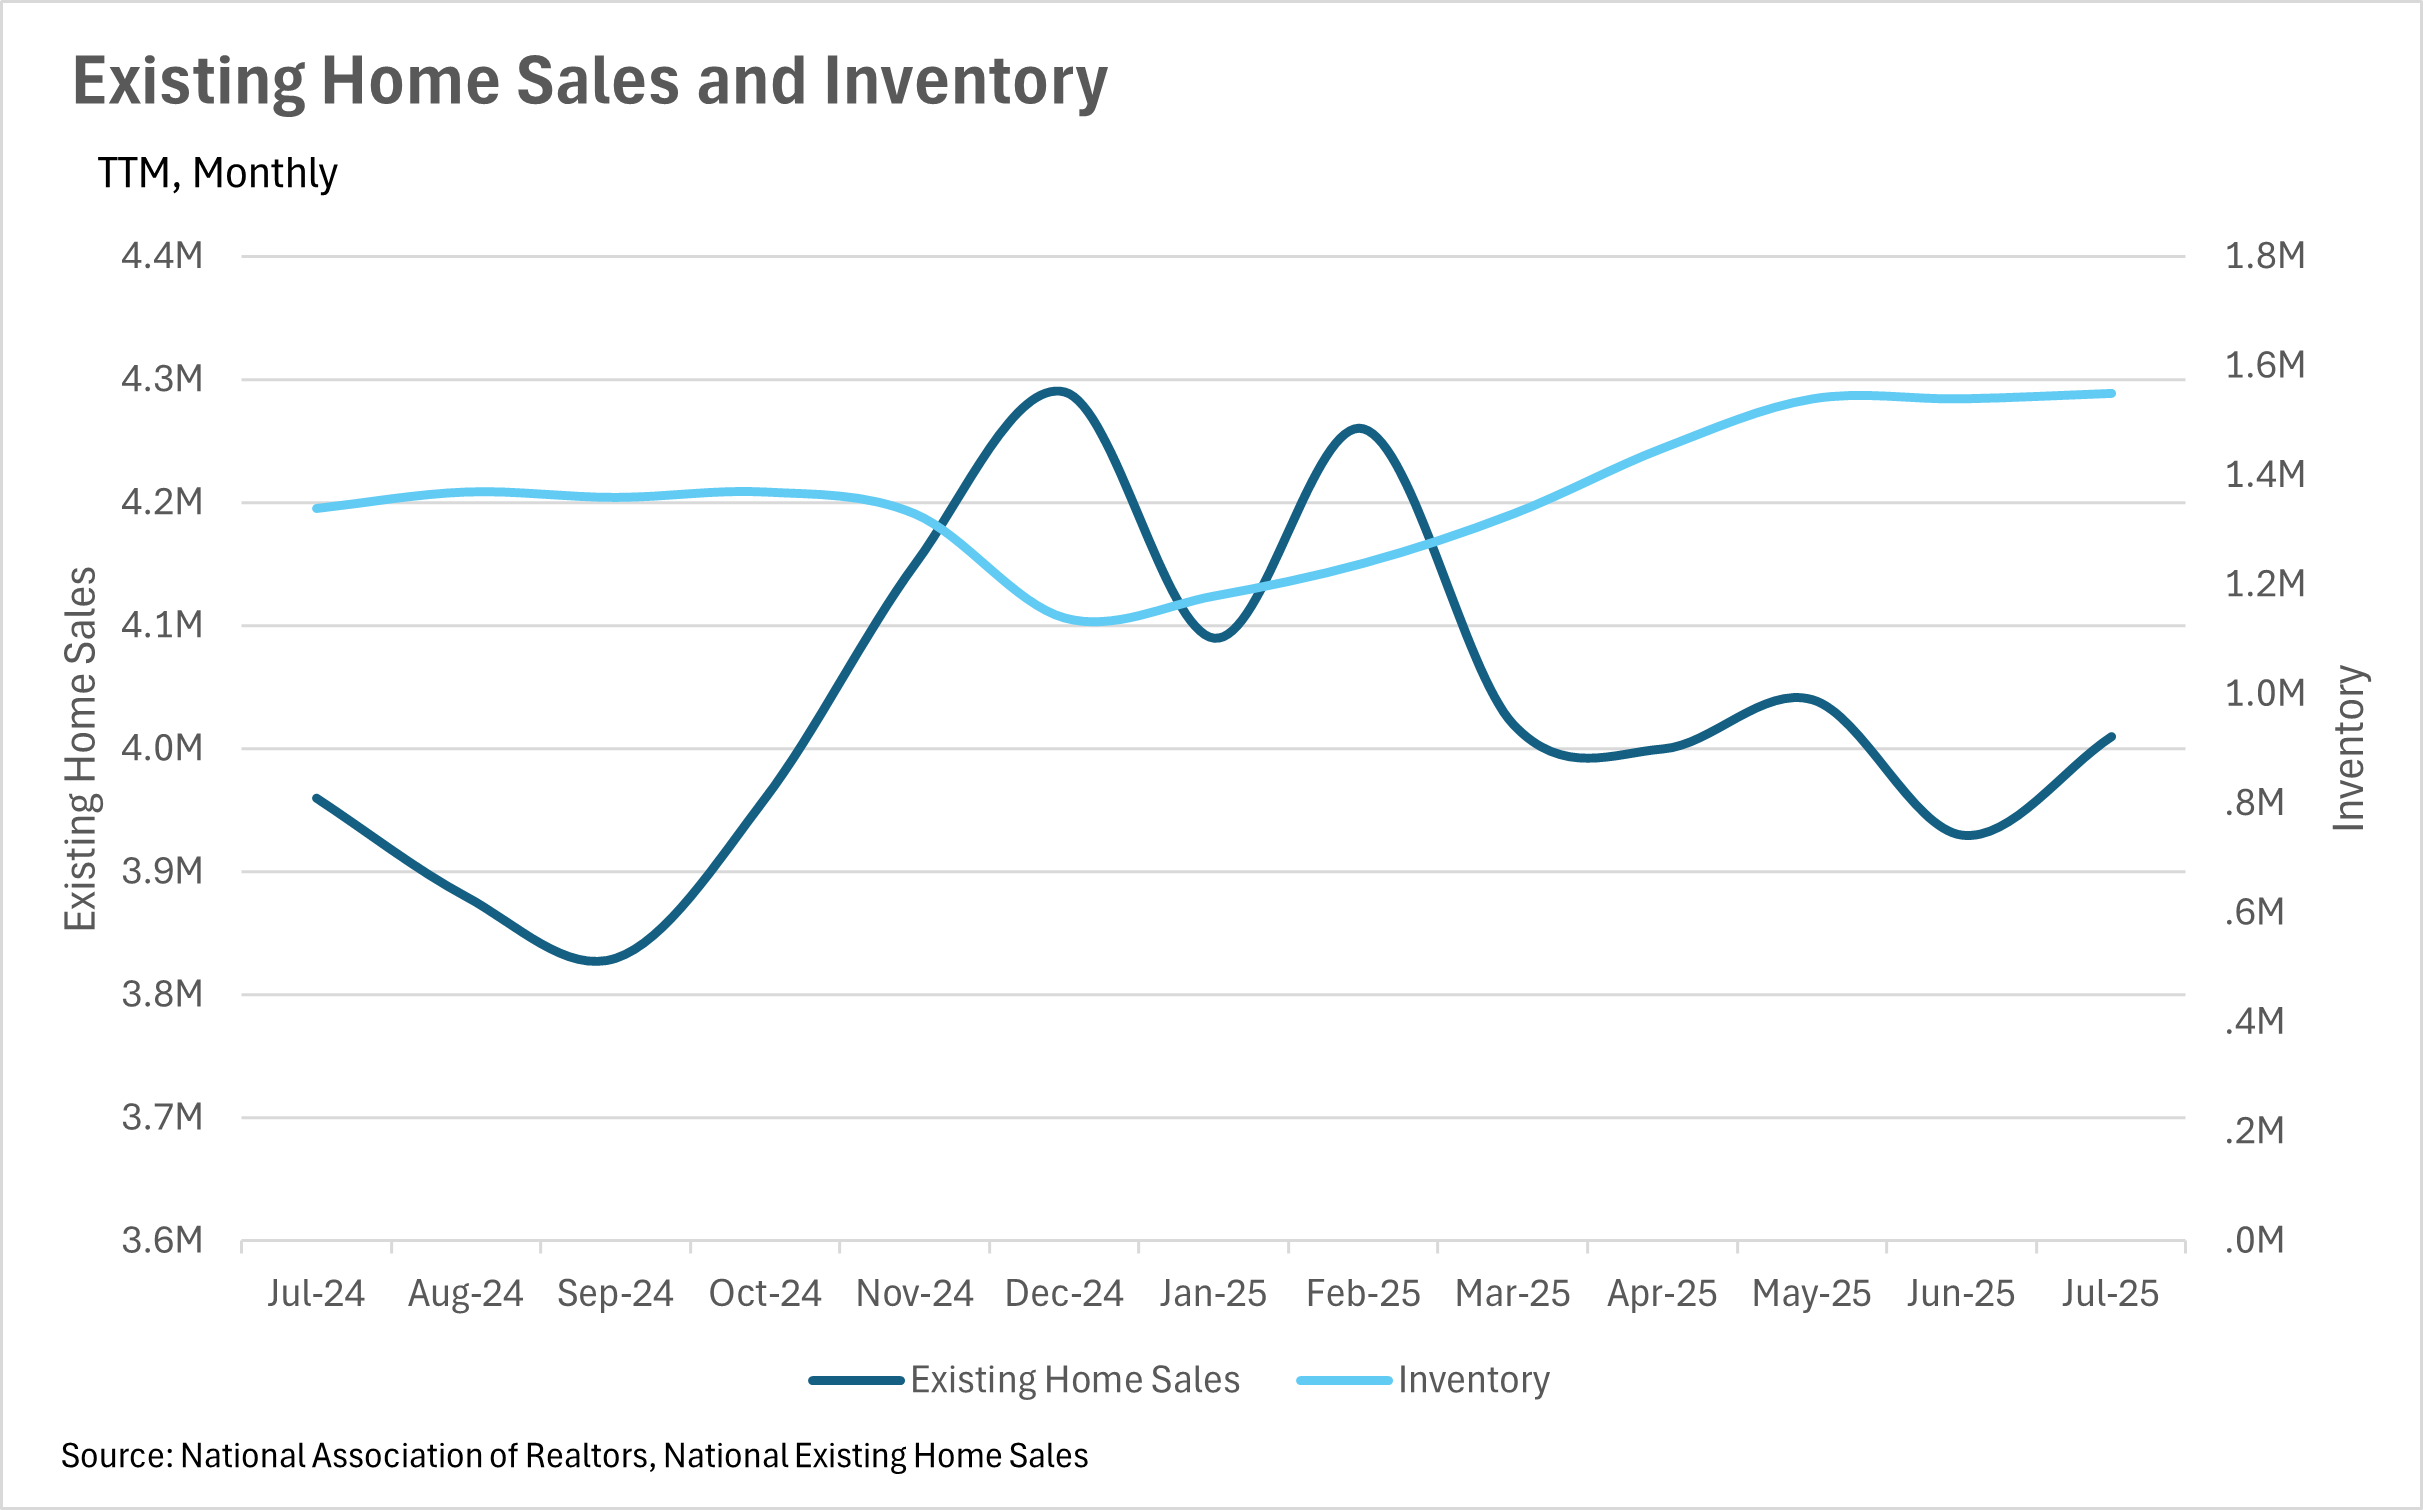
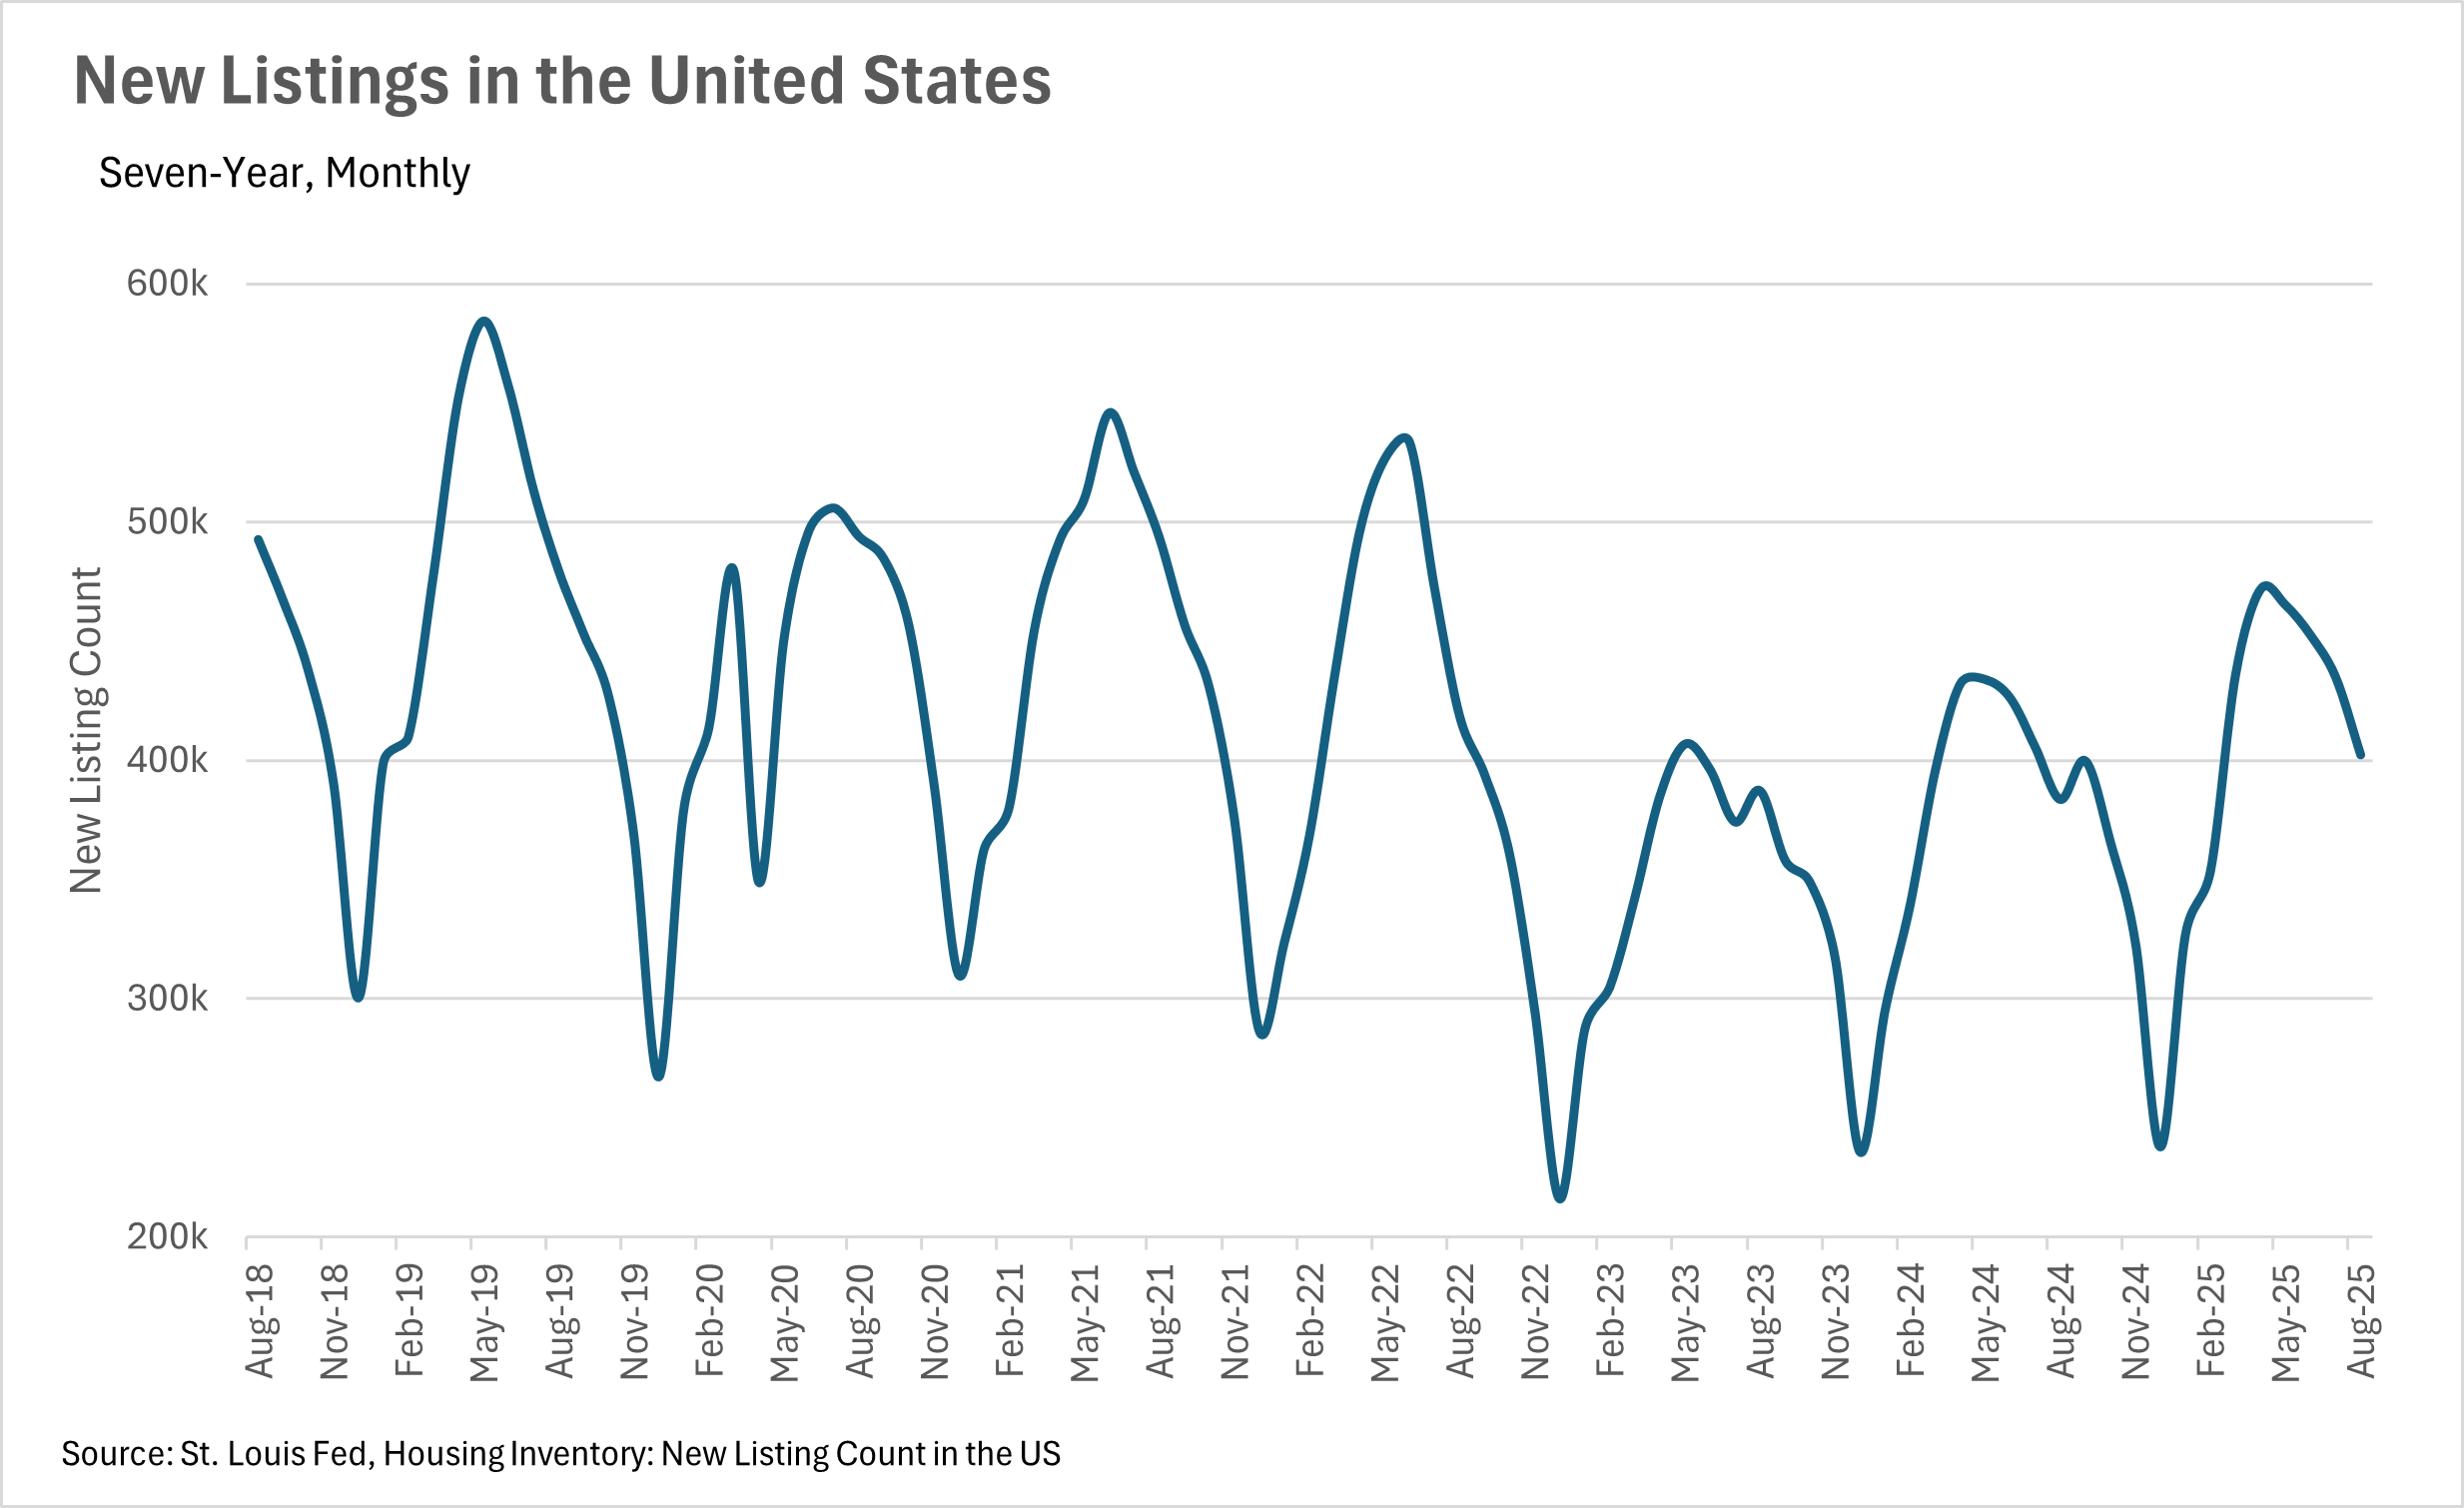
Over the course of the past few months, we’ve seen inventories remain at an elevated level on a year-over-year basis. However, with the recent drop in interest rates and the prospect of lower interest rates in the near-term future, we might see some of the built-up inventory begin to move, as housing becomes more affordable. Over the coming months, it’ll be important to pay attention to inventory levels, as they’re often leading indicators of price movements over time!
It’s important to note, though, that all of this is just what we’re seeing at a national level. To learn more about your local market, be sure to check out the Local Lowdown below:
Note: You can find the charts/graphs for the Local Lowdown at the end of this section.
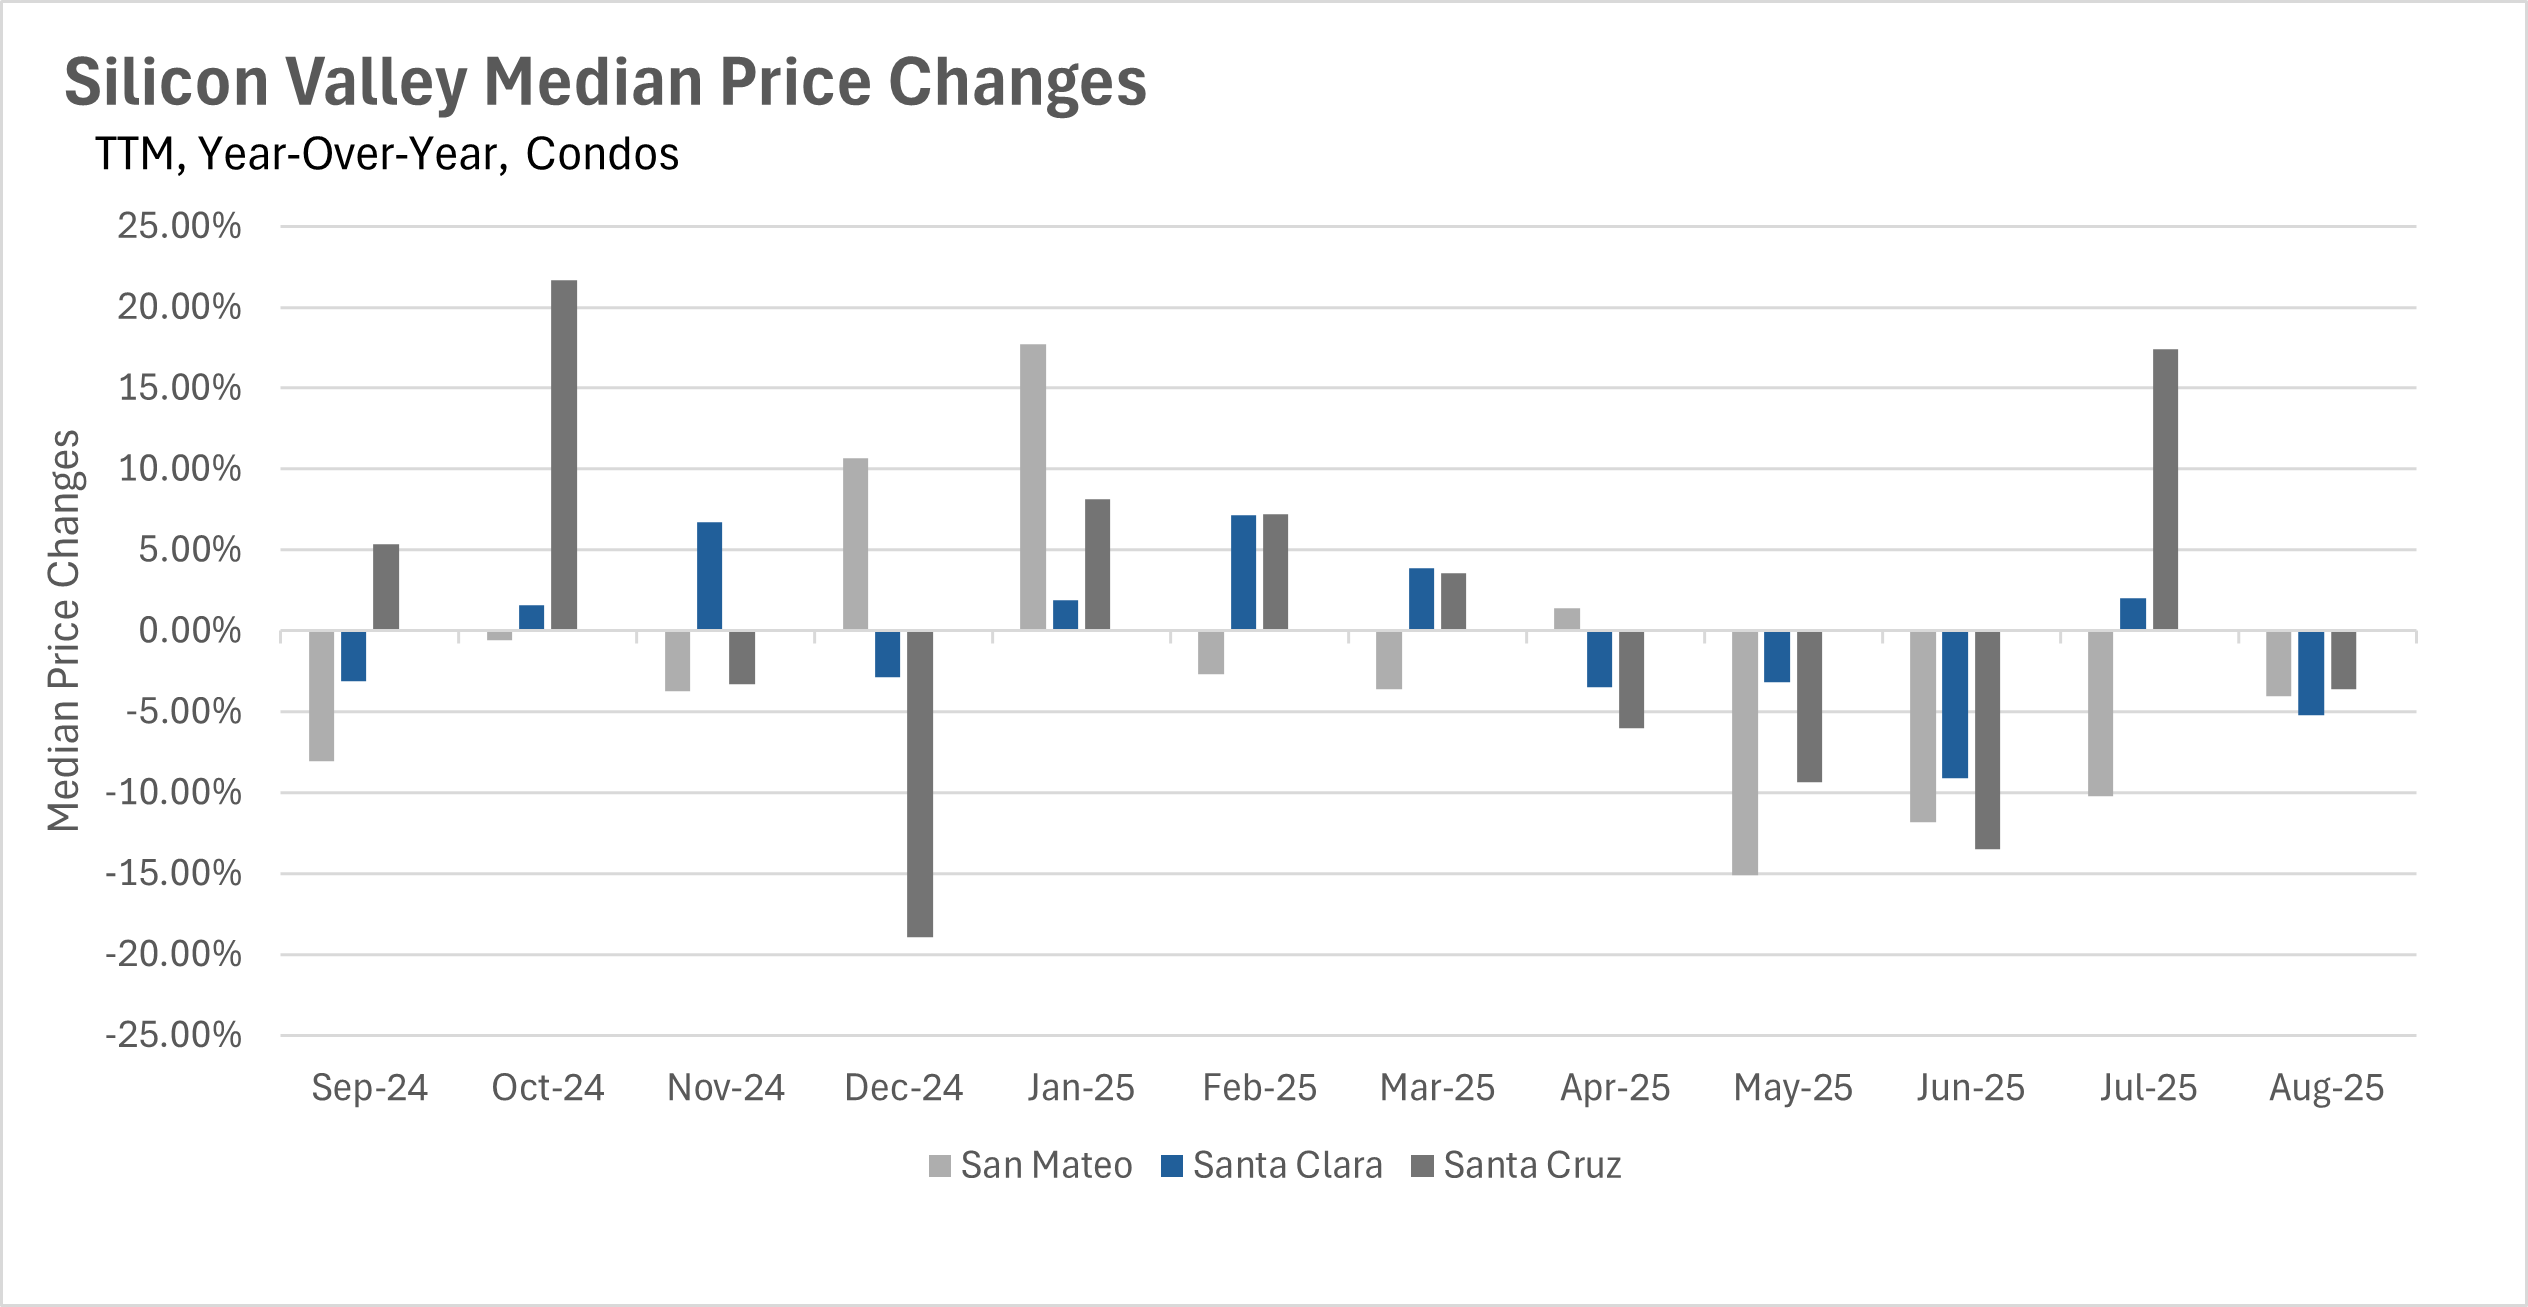
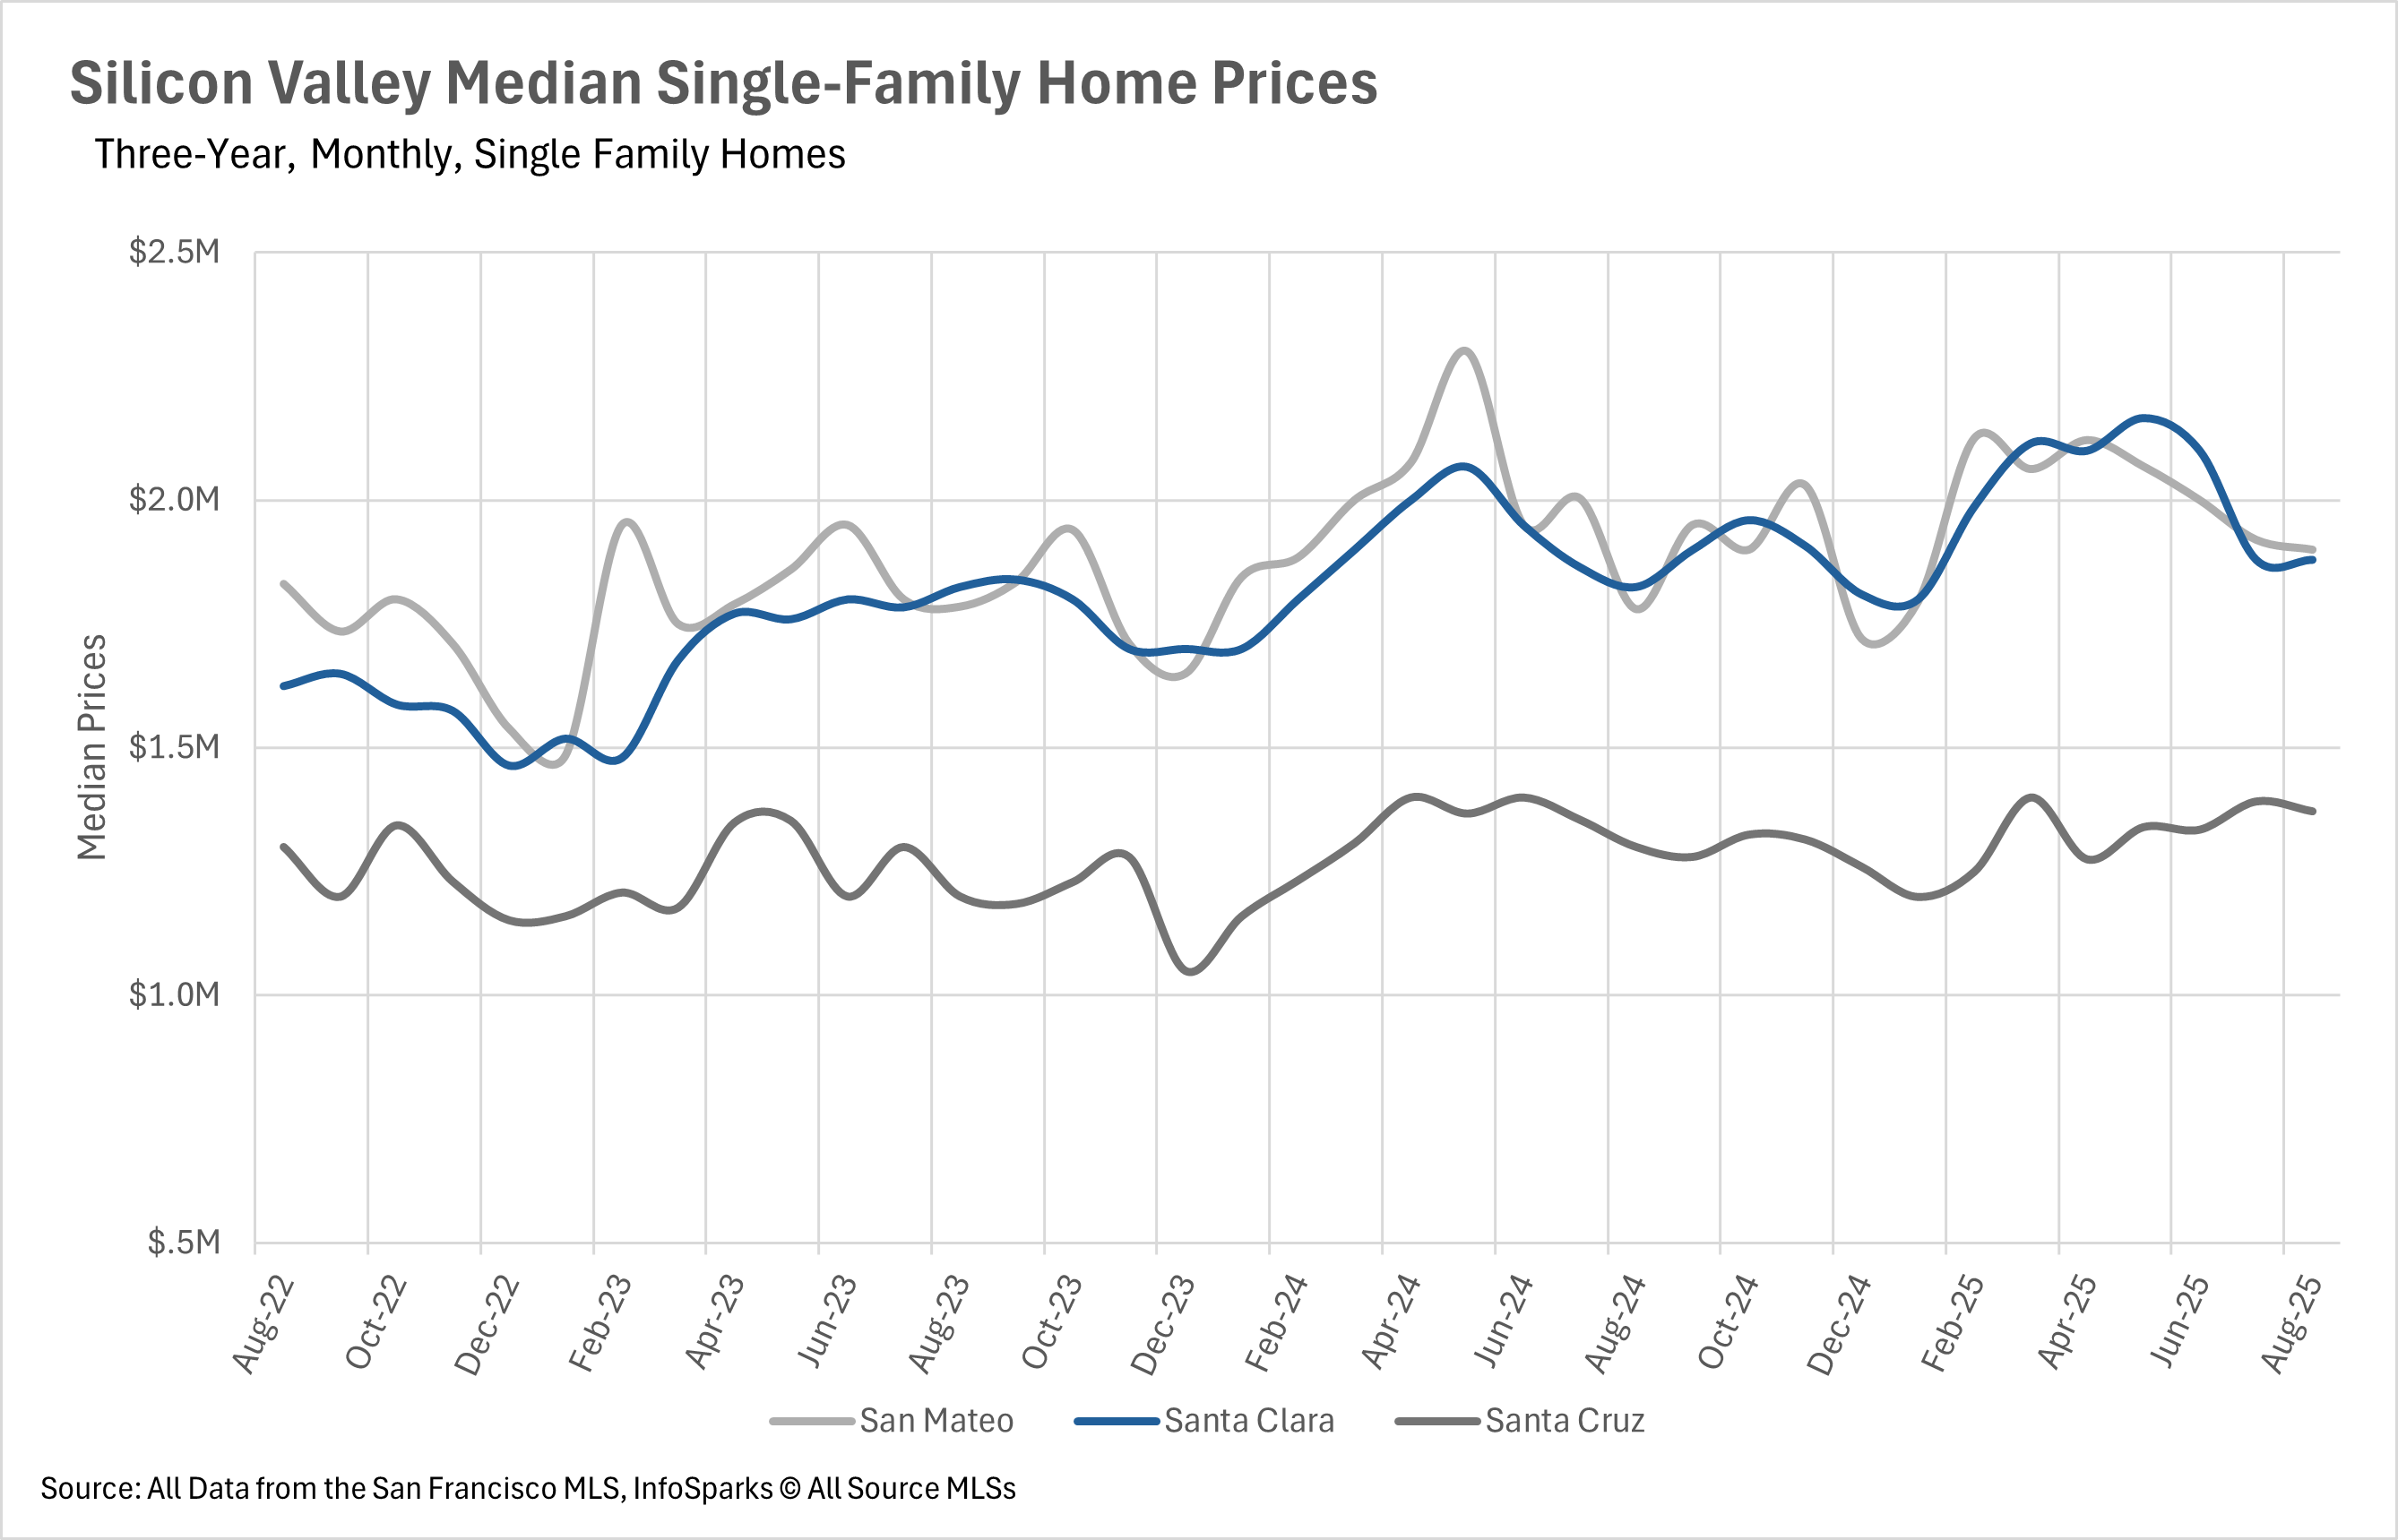
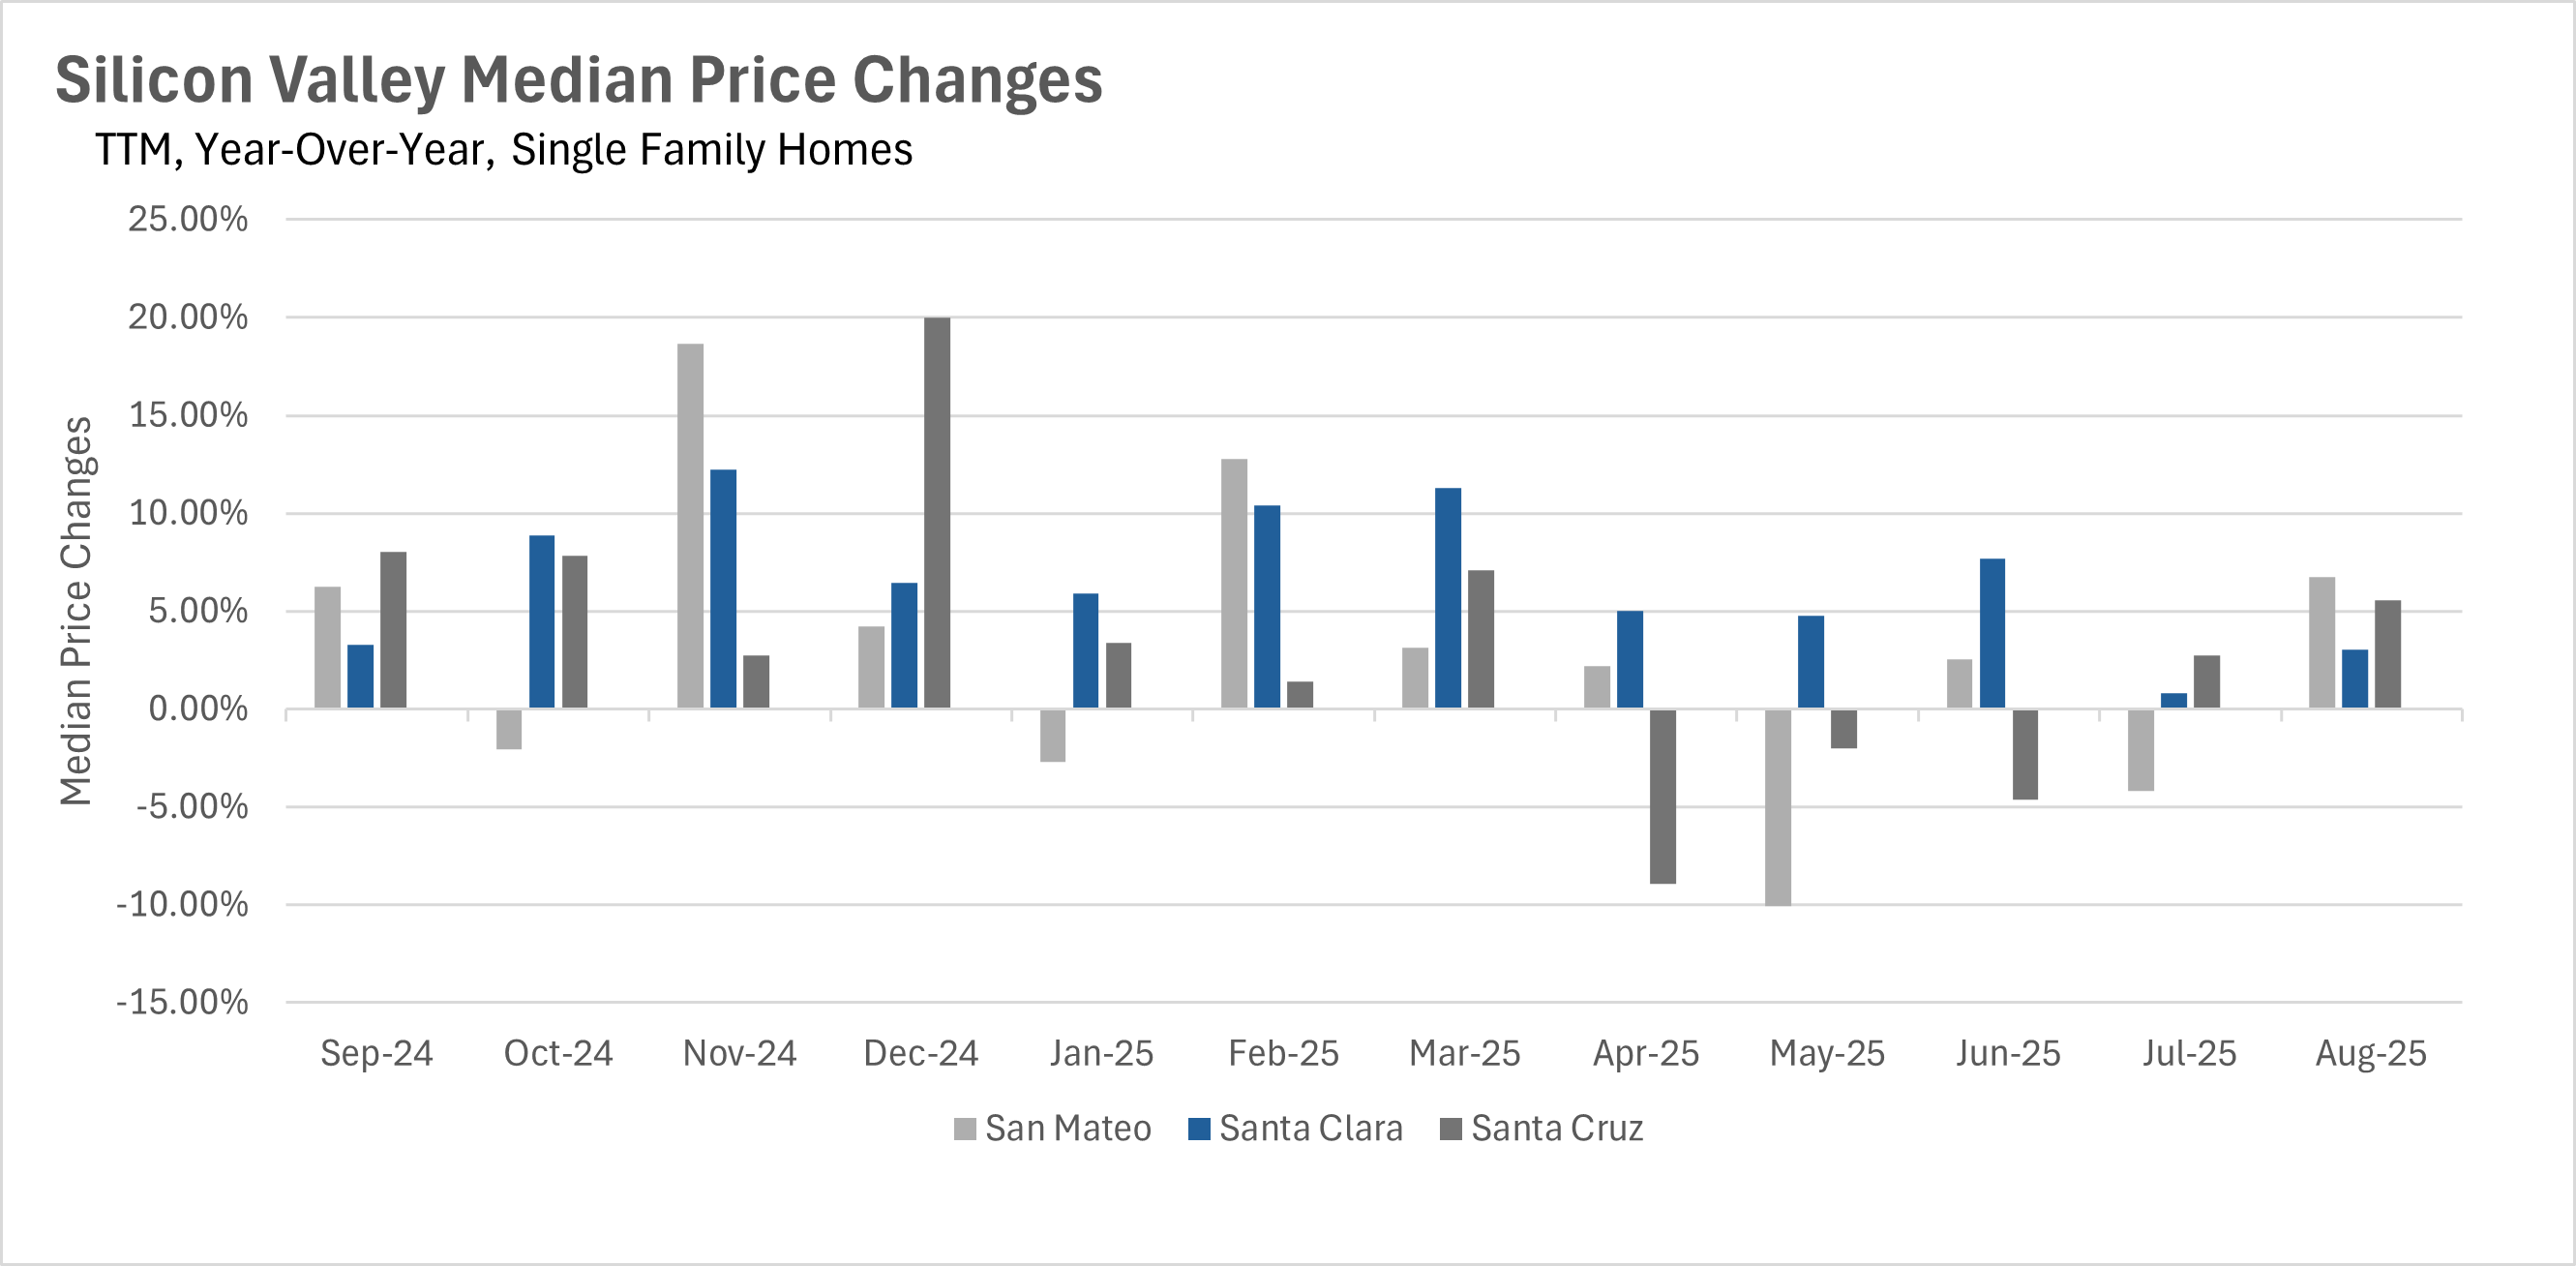
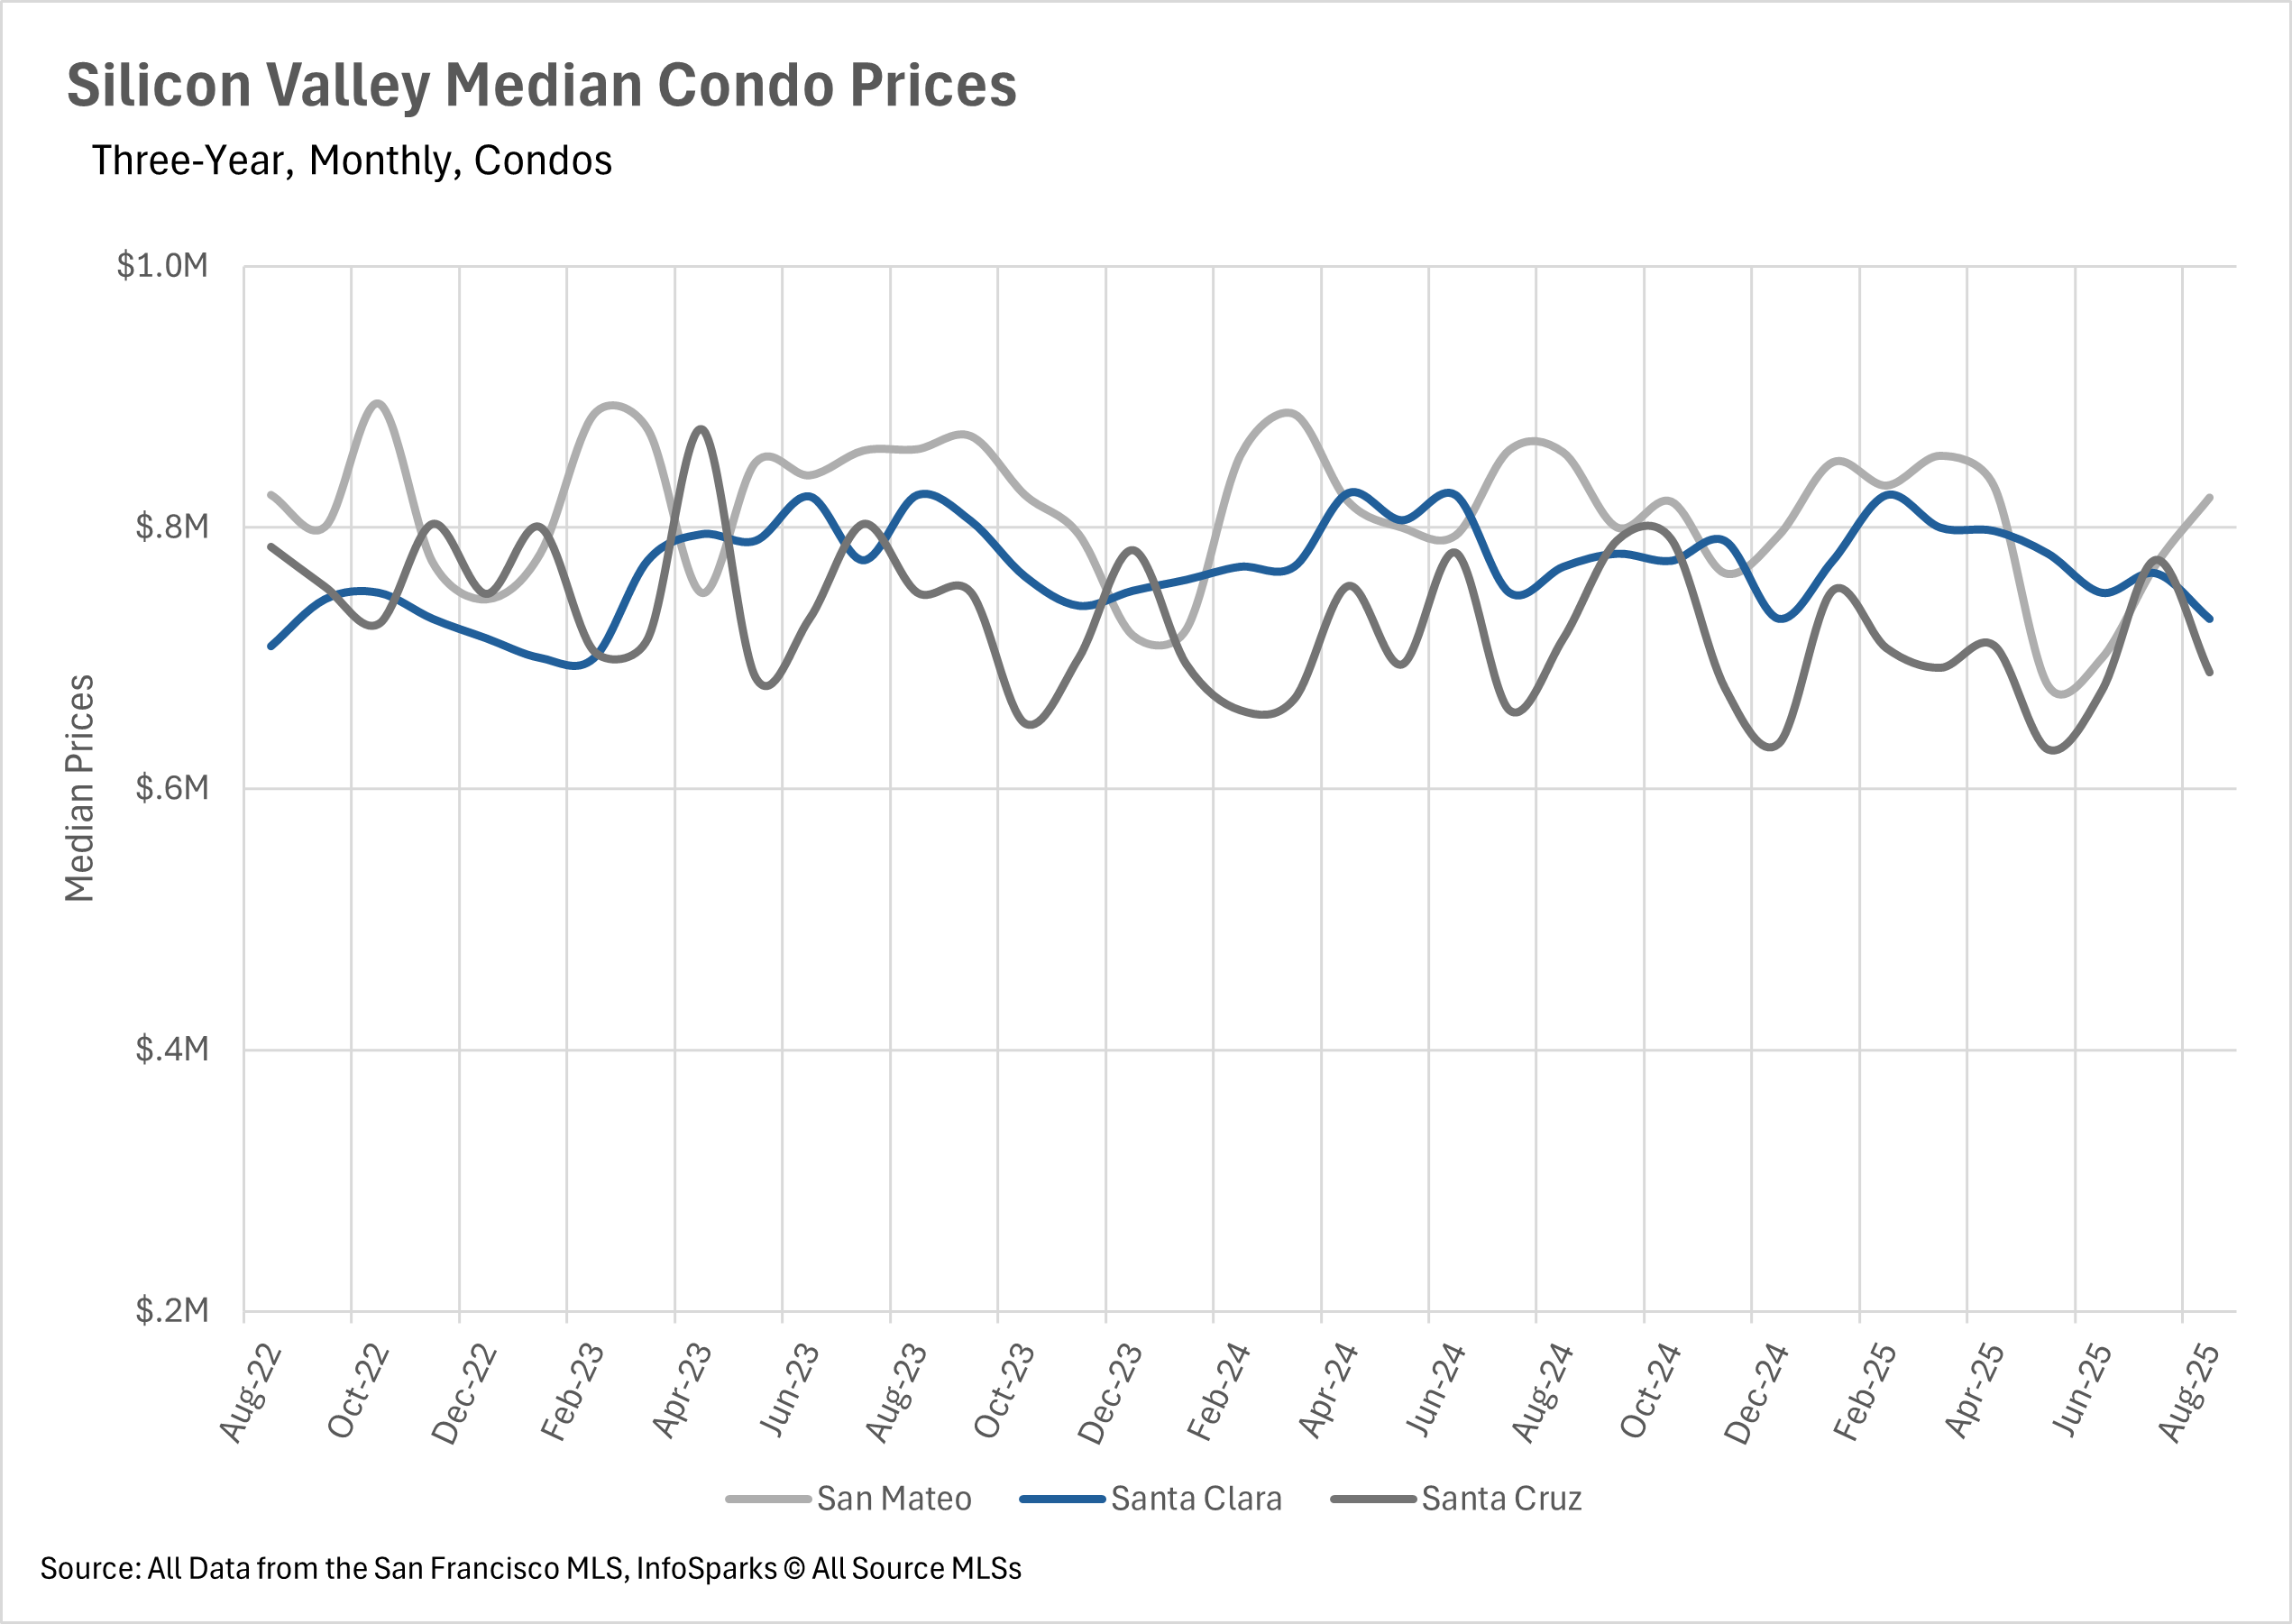
In recent years, Silicon Valley has been one of the strongest markets in terms of price appreciation. However, over the past few months, there has been quite a bit of softness, as certain counties saw their first year-over-year price declines in over a year. However, in August, we saw price appreciation across the board in the single-family home market, with median sale prices increasing by 3.01%, 5.54%, and 6.74% in Santa Clara, Santa Cruz, and San Mateo Counties, respectively. Unfortunately, the same cannot be said for the condo market, though, as we saw year-over-year decreases in median sale price across the board. Median sale prices decreased by 3.64% in Santa Cruz County, 4.02% in San Mateo County, and 5.20% in Santa Clara County, on a year-over-year basis.
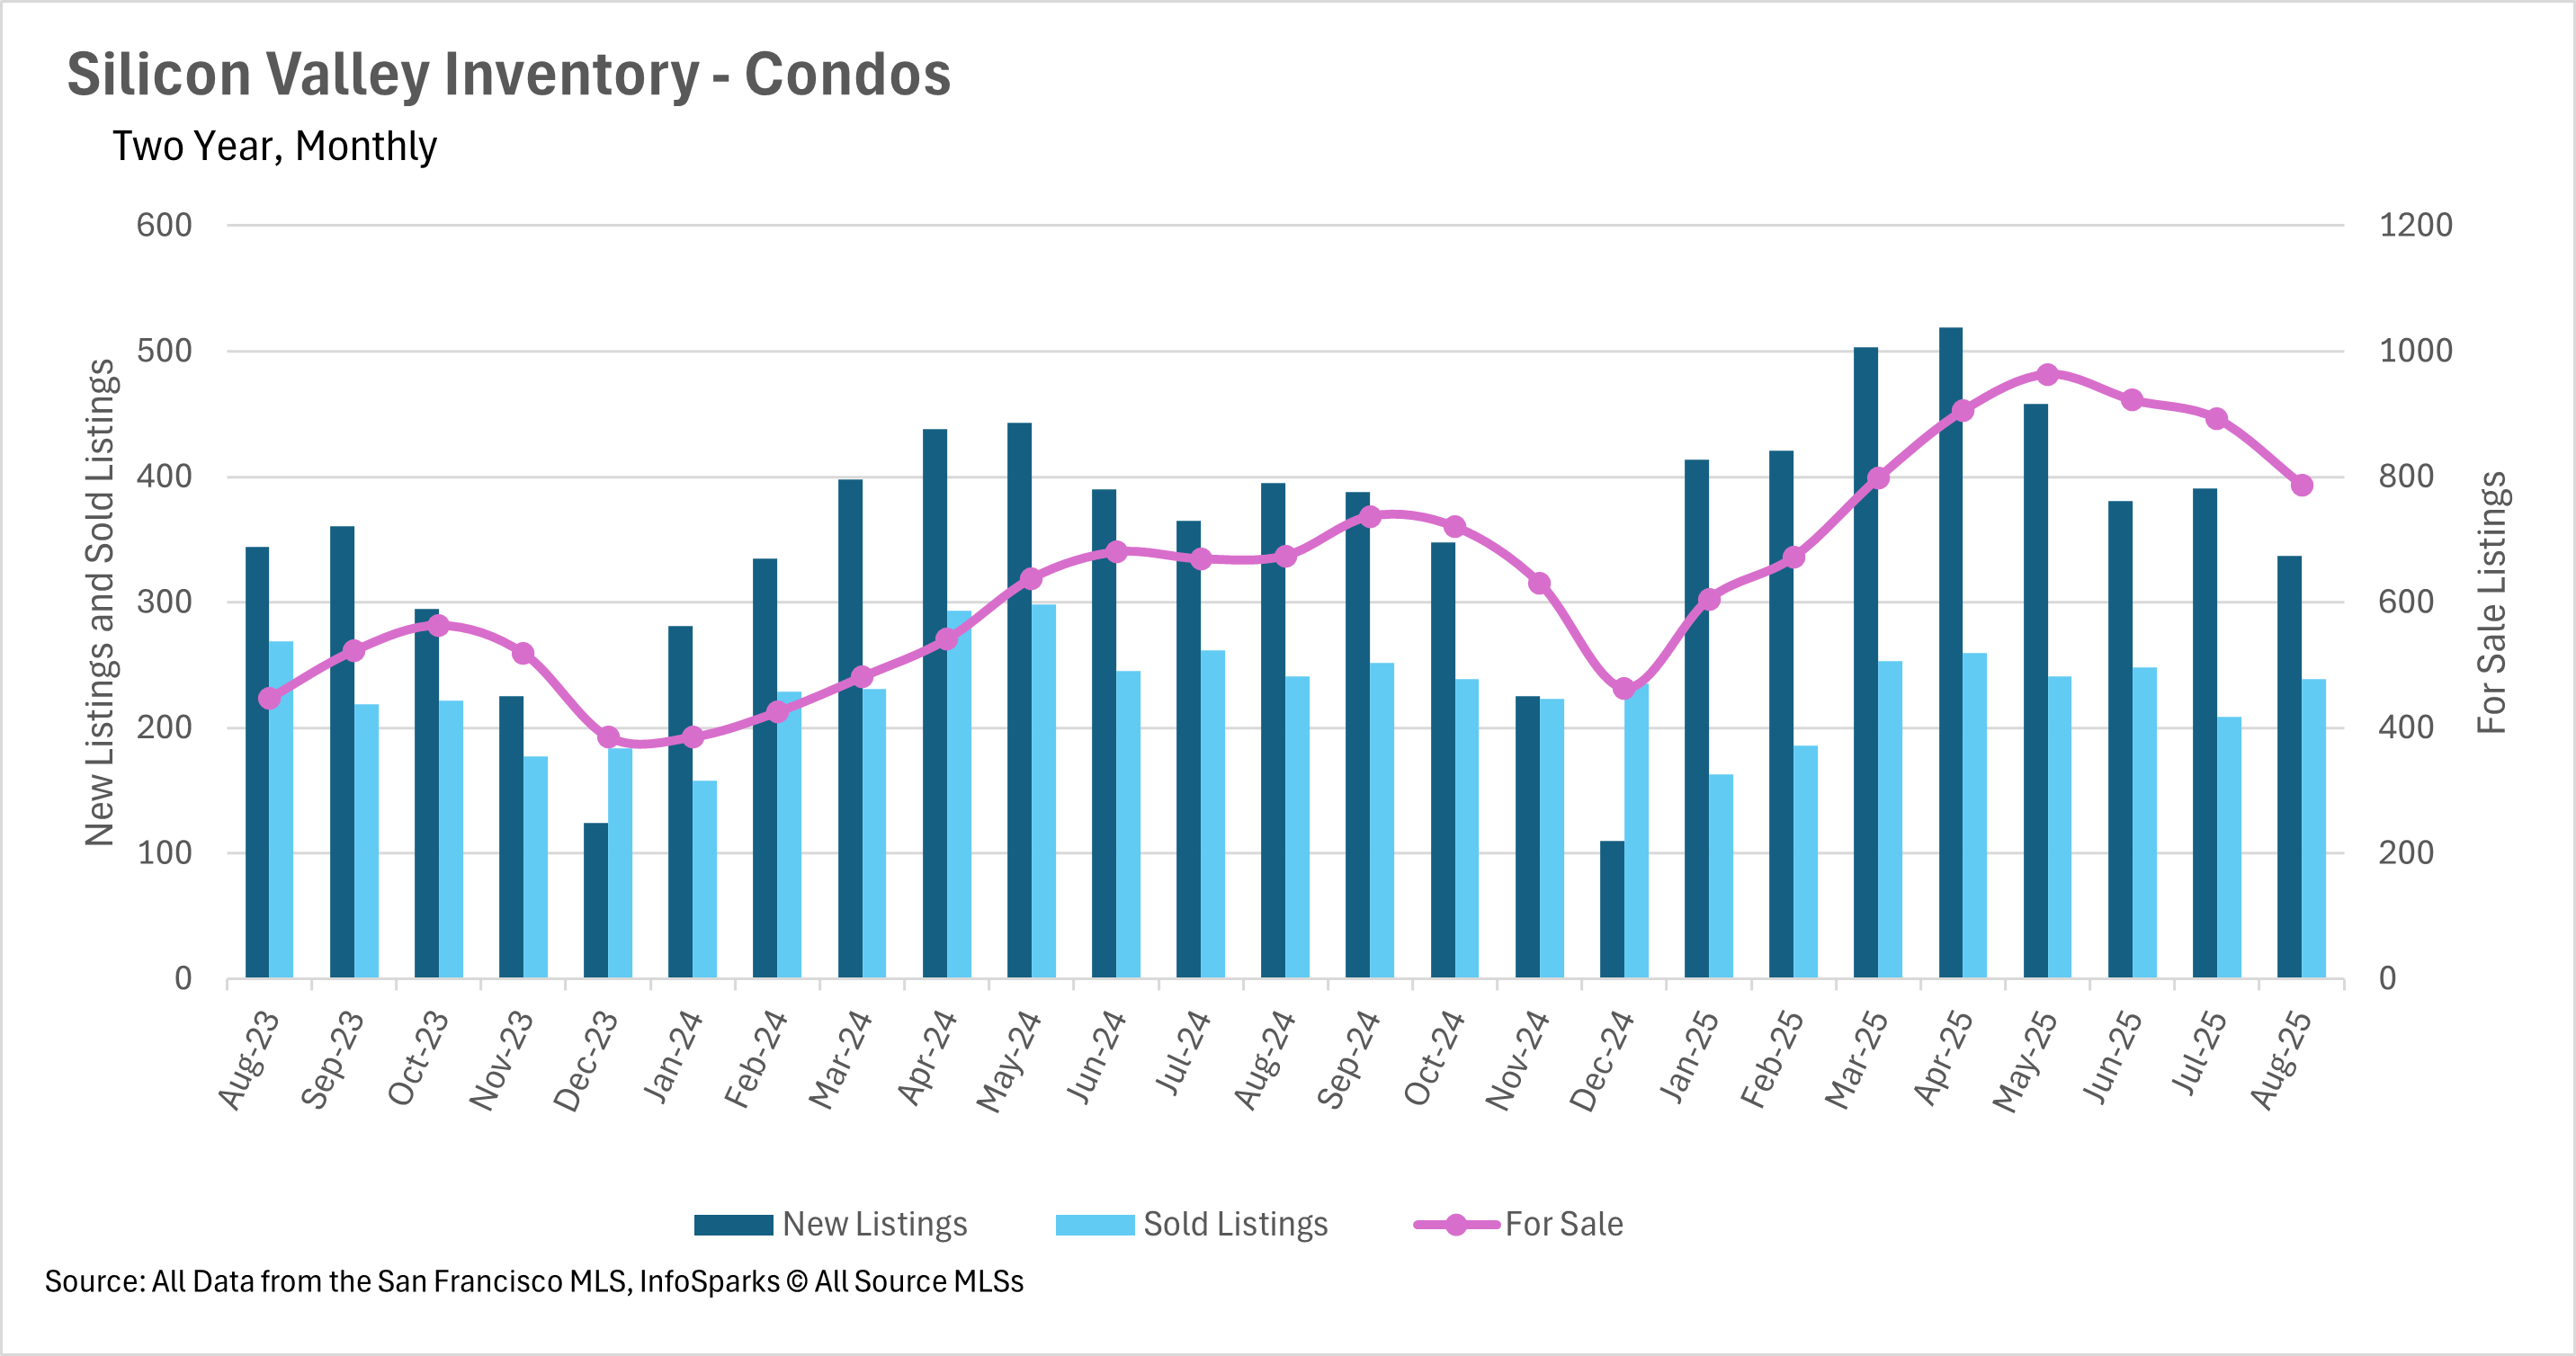
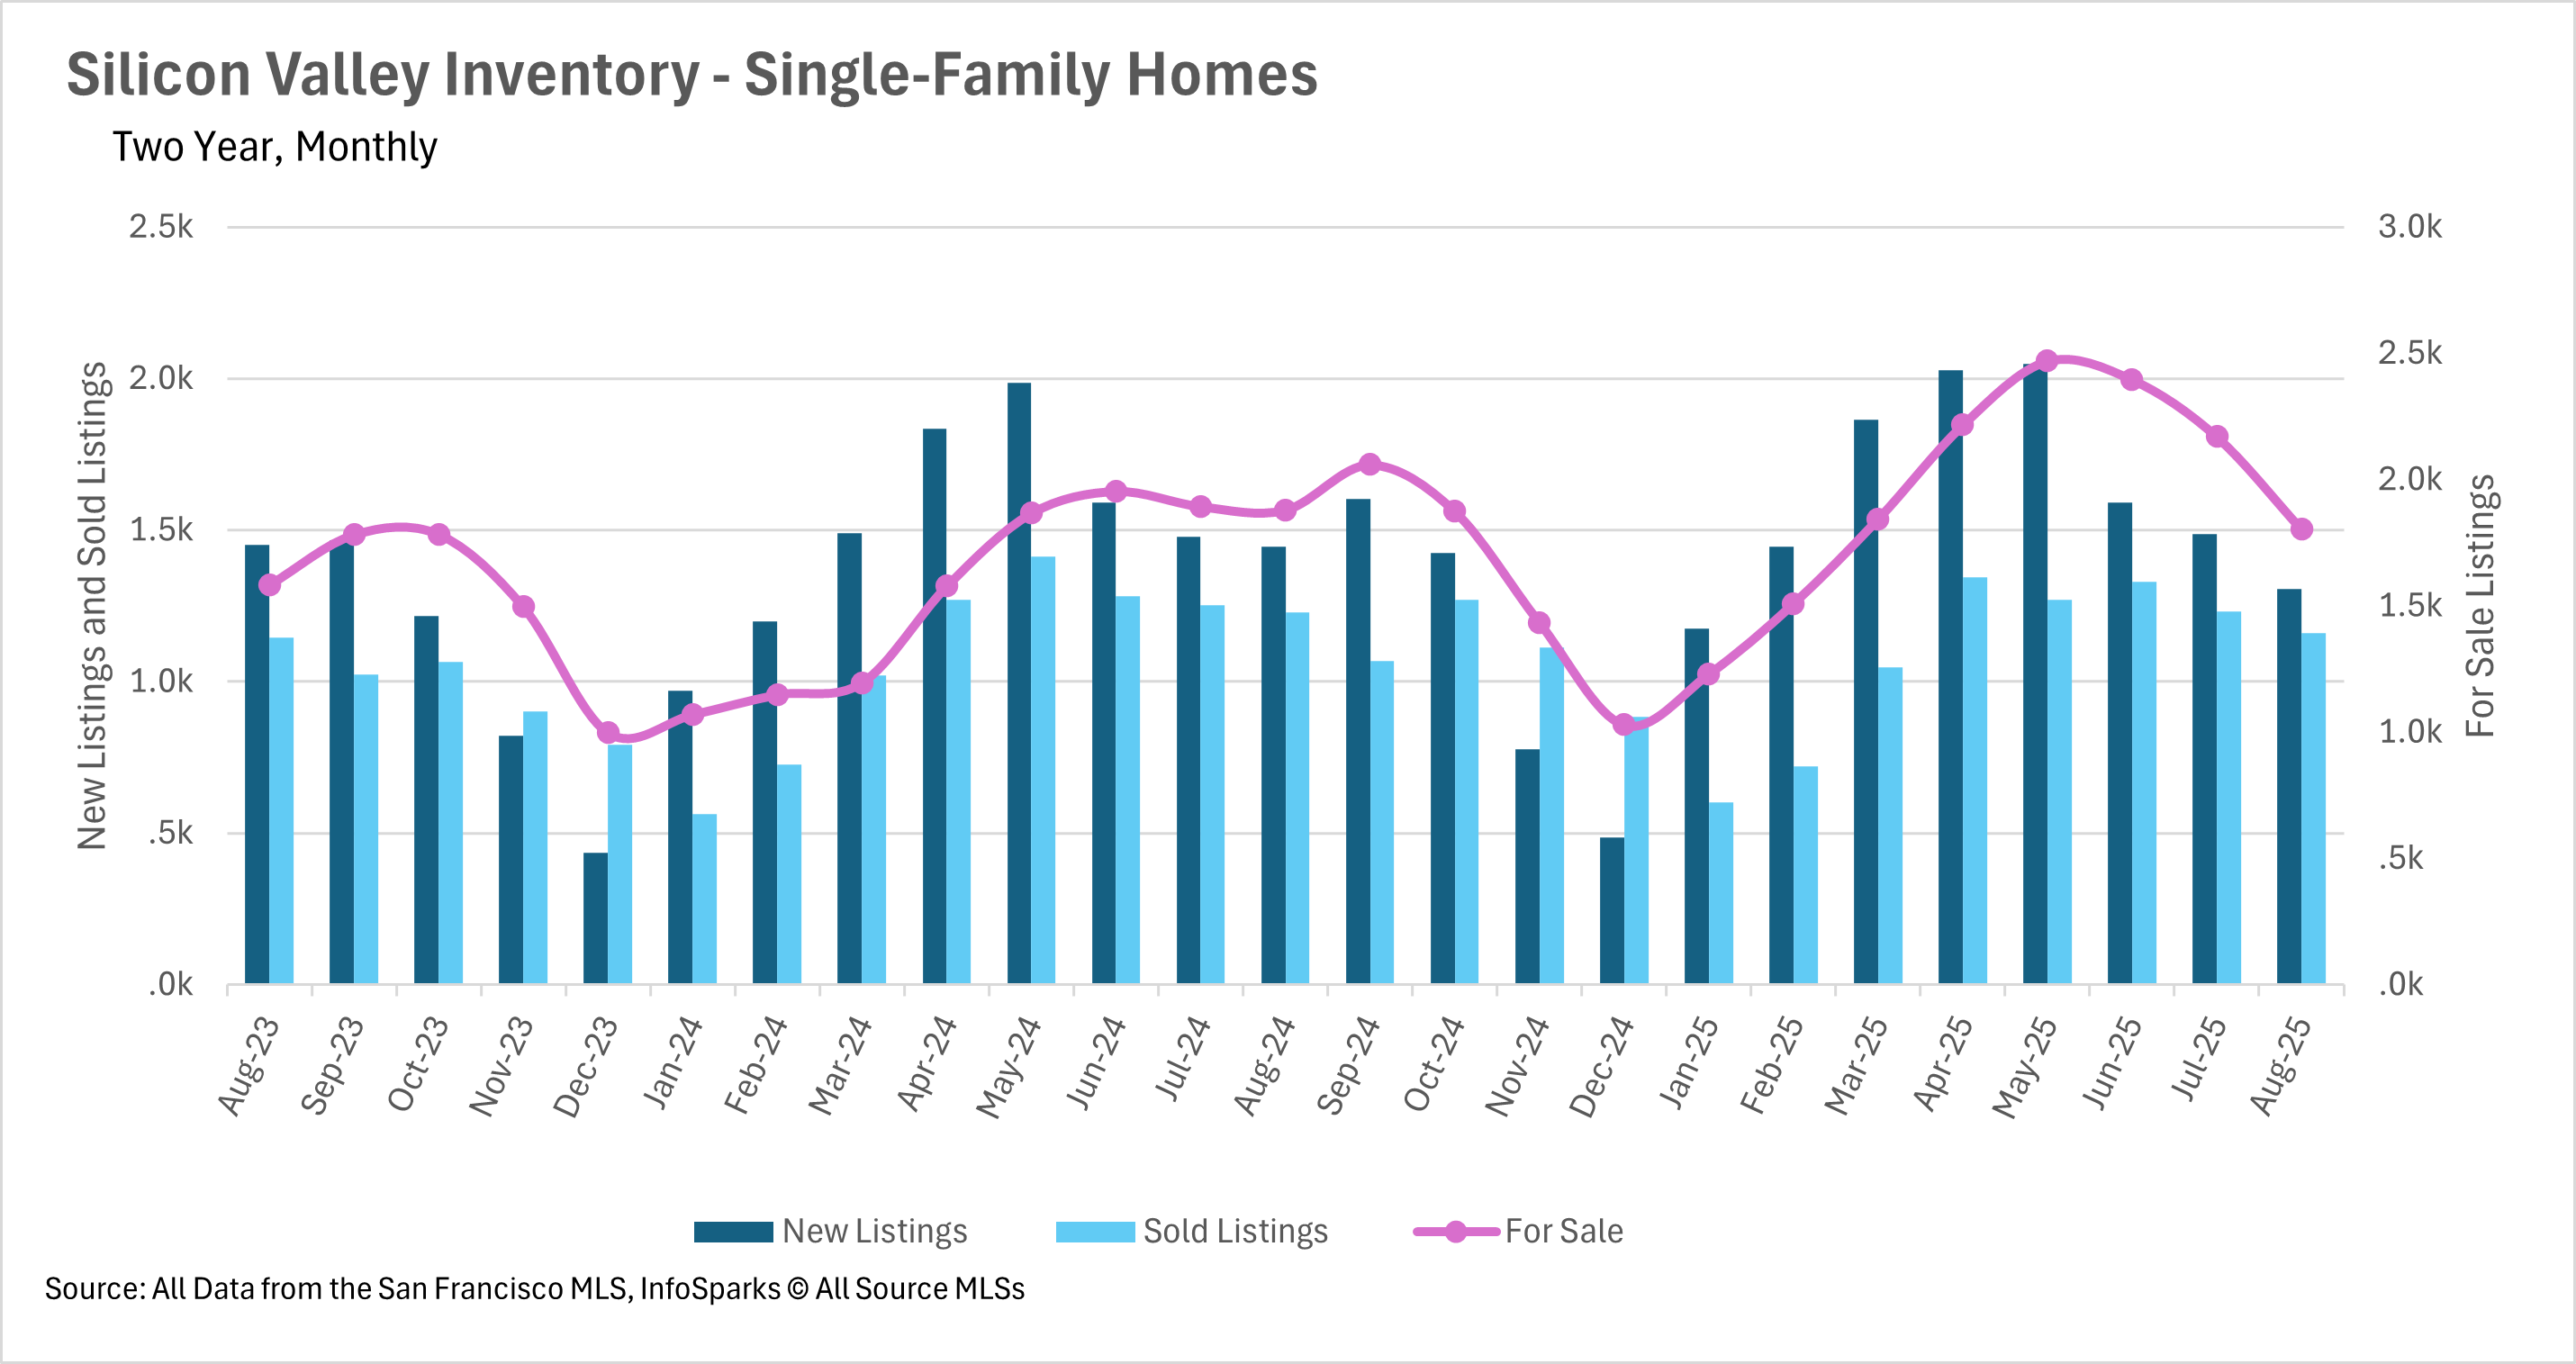
Inventories have been building throughout California, starting in late spring and continuing throughout the early summer, resulting in many areas having considerably more inventory on the market on a year-over-year basis. However, inventories began to normalize in the back half of the summer, with the Silicon Valley single-family home market making a full reversal in August. In fact, Silicon Valley ended August with 4.04% fewer active single-family listings on the market when compared to last year! The condo market has not made this same recovery, but it is on the same trajectory, with 16.77% more inventory on the market than this time last year - a drastic decrease when compared to prior months.
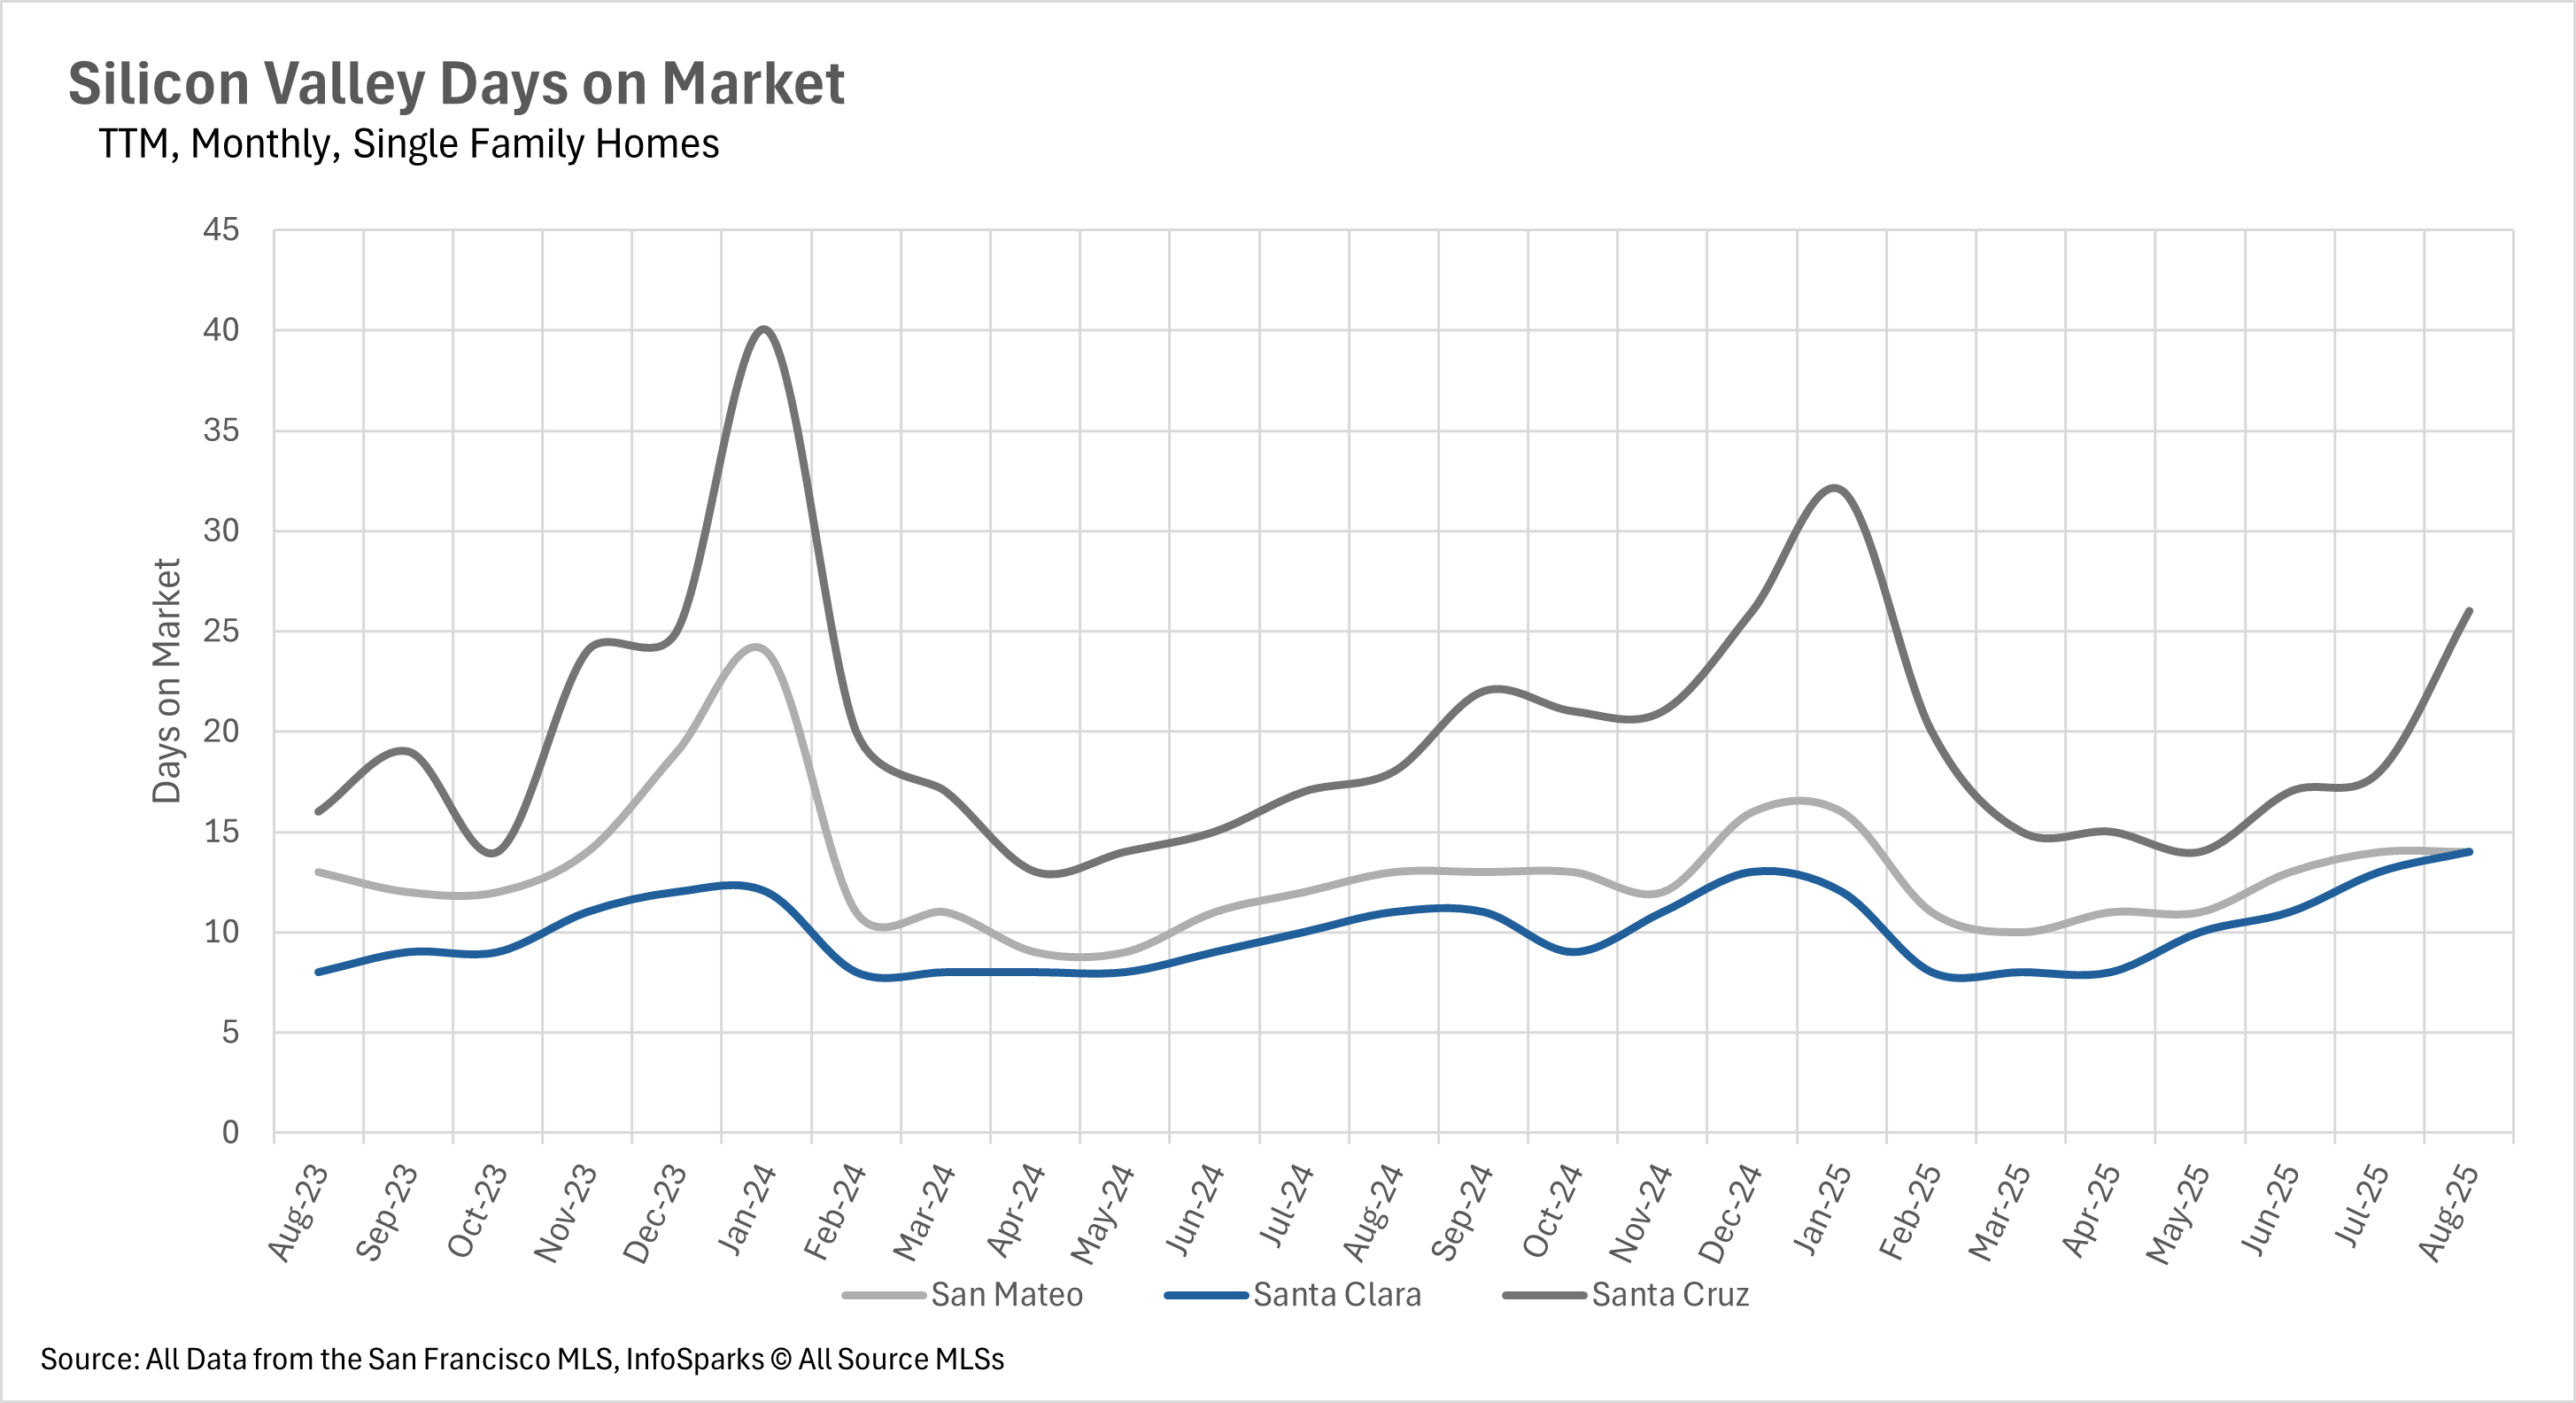
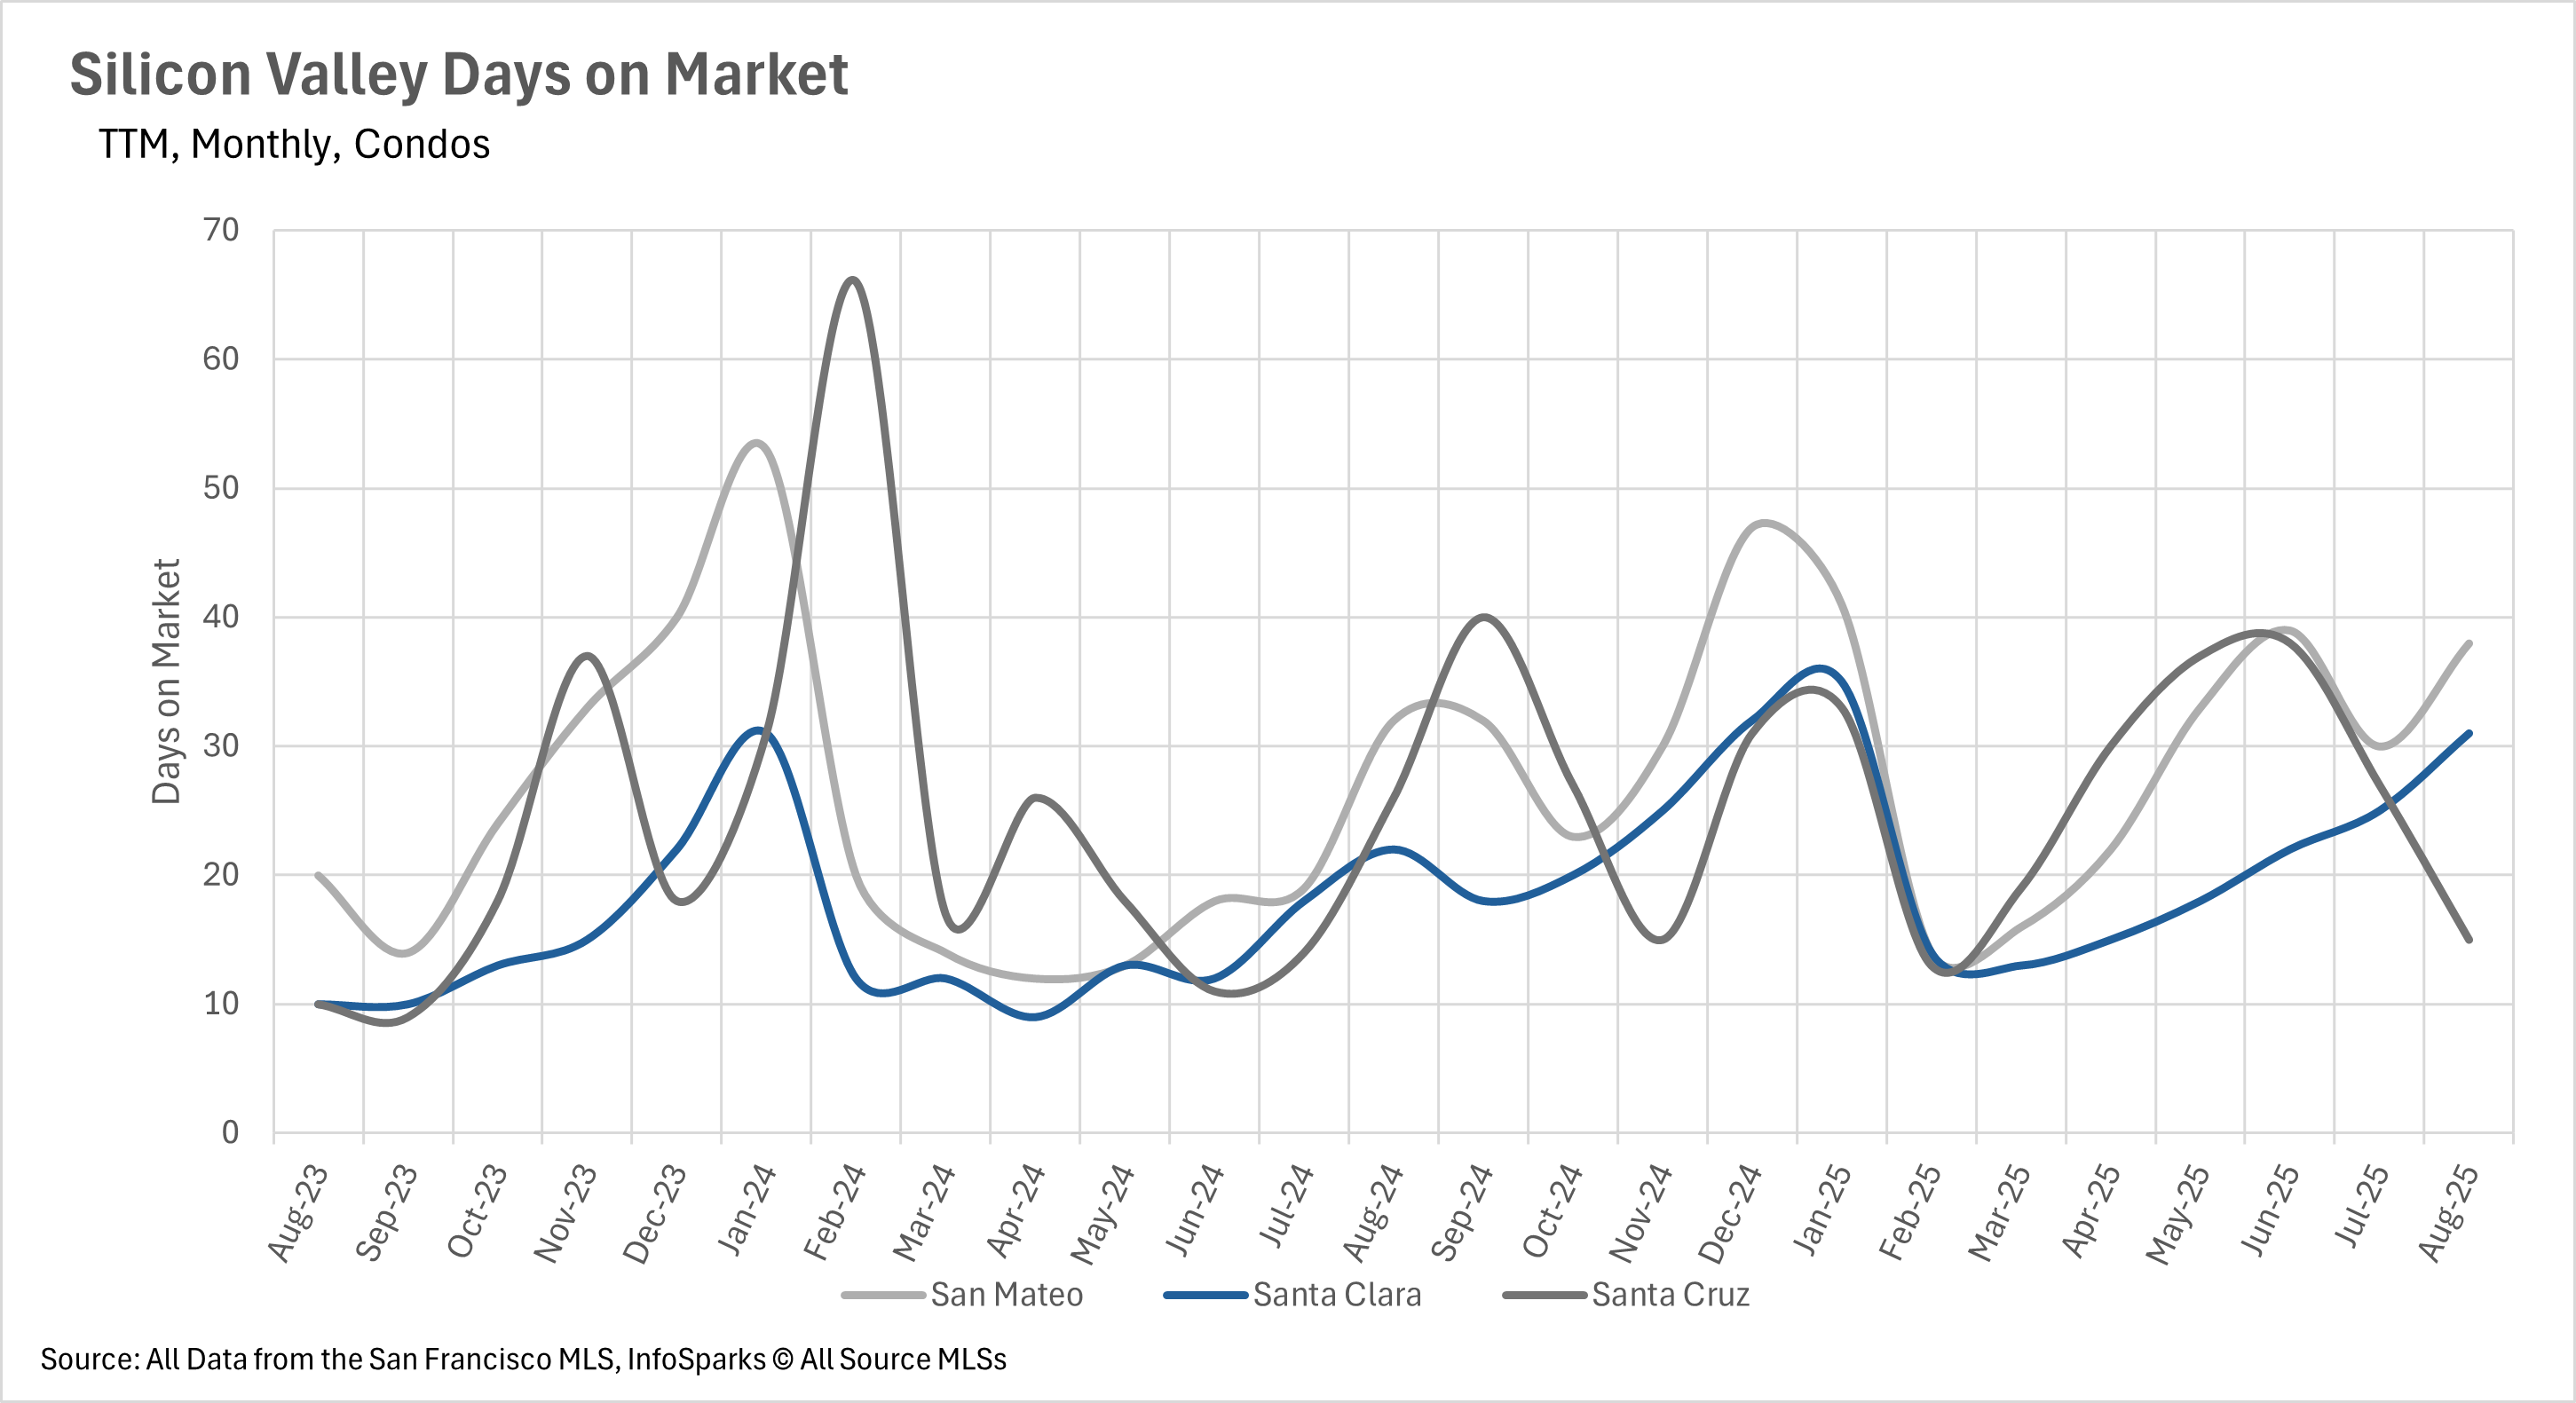
Although single-family homes are spending quite a bit more time on the market on a percentage basis when you compare to last year, on an absolute basis, they’re still moving incredibly quickly. The average single-family listing in San Mateo and Santa Clara Counties spends just 14 days on the market, and the average listing in Santa Cruz County spends 26 days on the market. When we look to the condo market, things generally move a bit slower, with the average condo in Santa Clara County spending 31 days on the market, and the average condo in San Mateo County spending 38 days on the market. Santa Cruz County bucks the trend here, with the average condo spending just 15 days on the market.
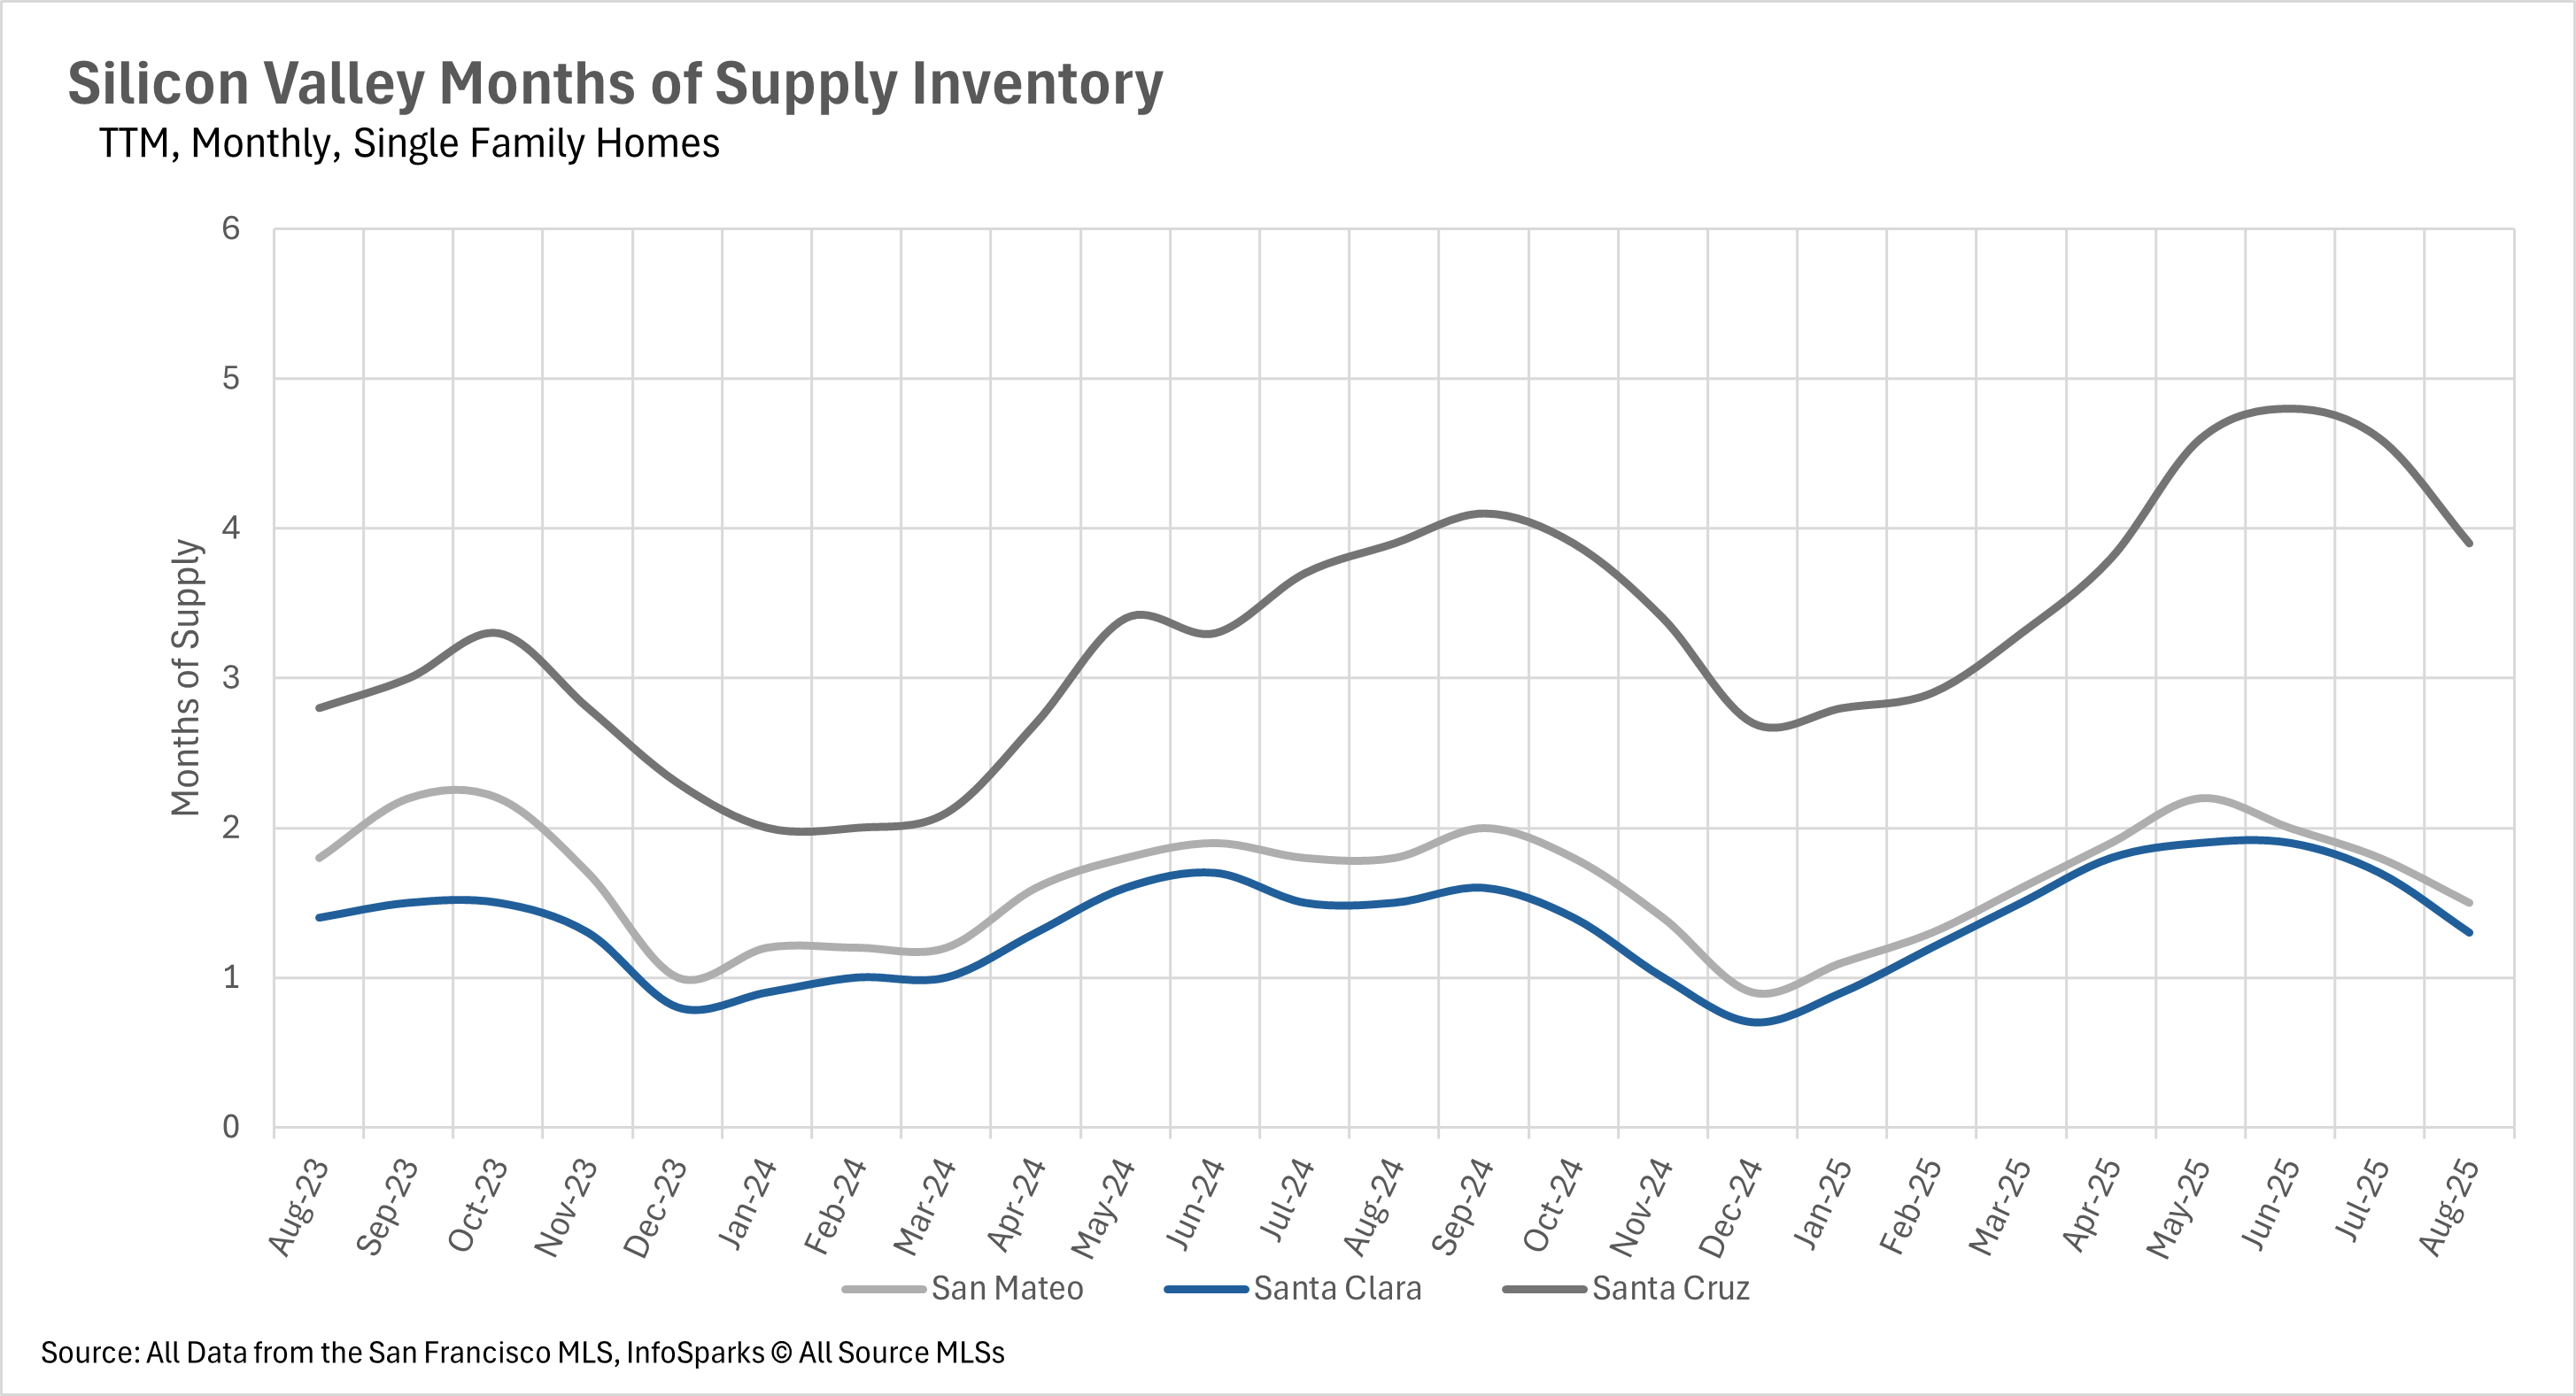
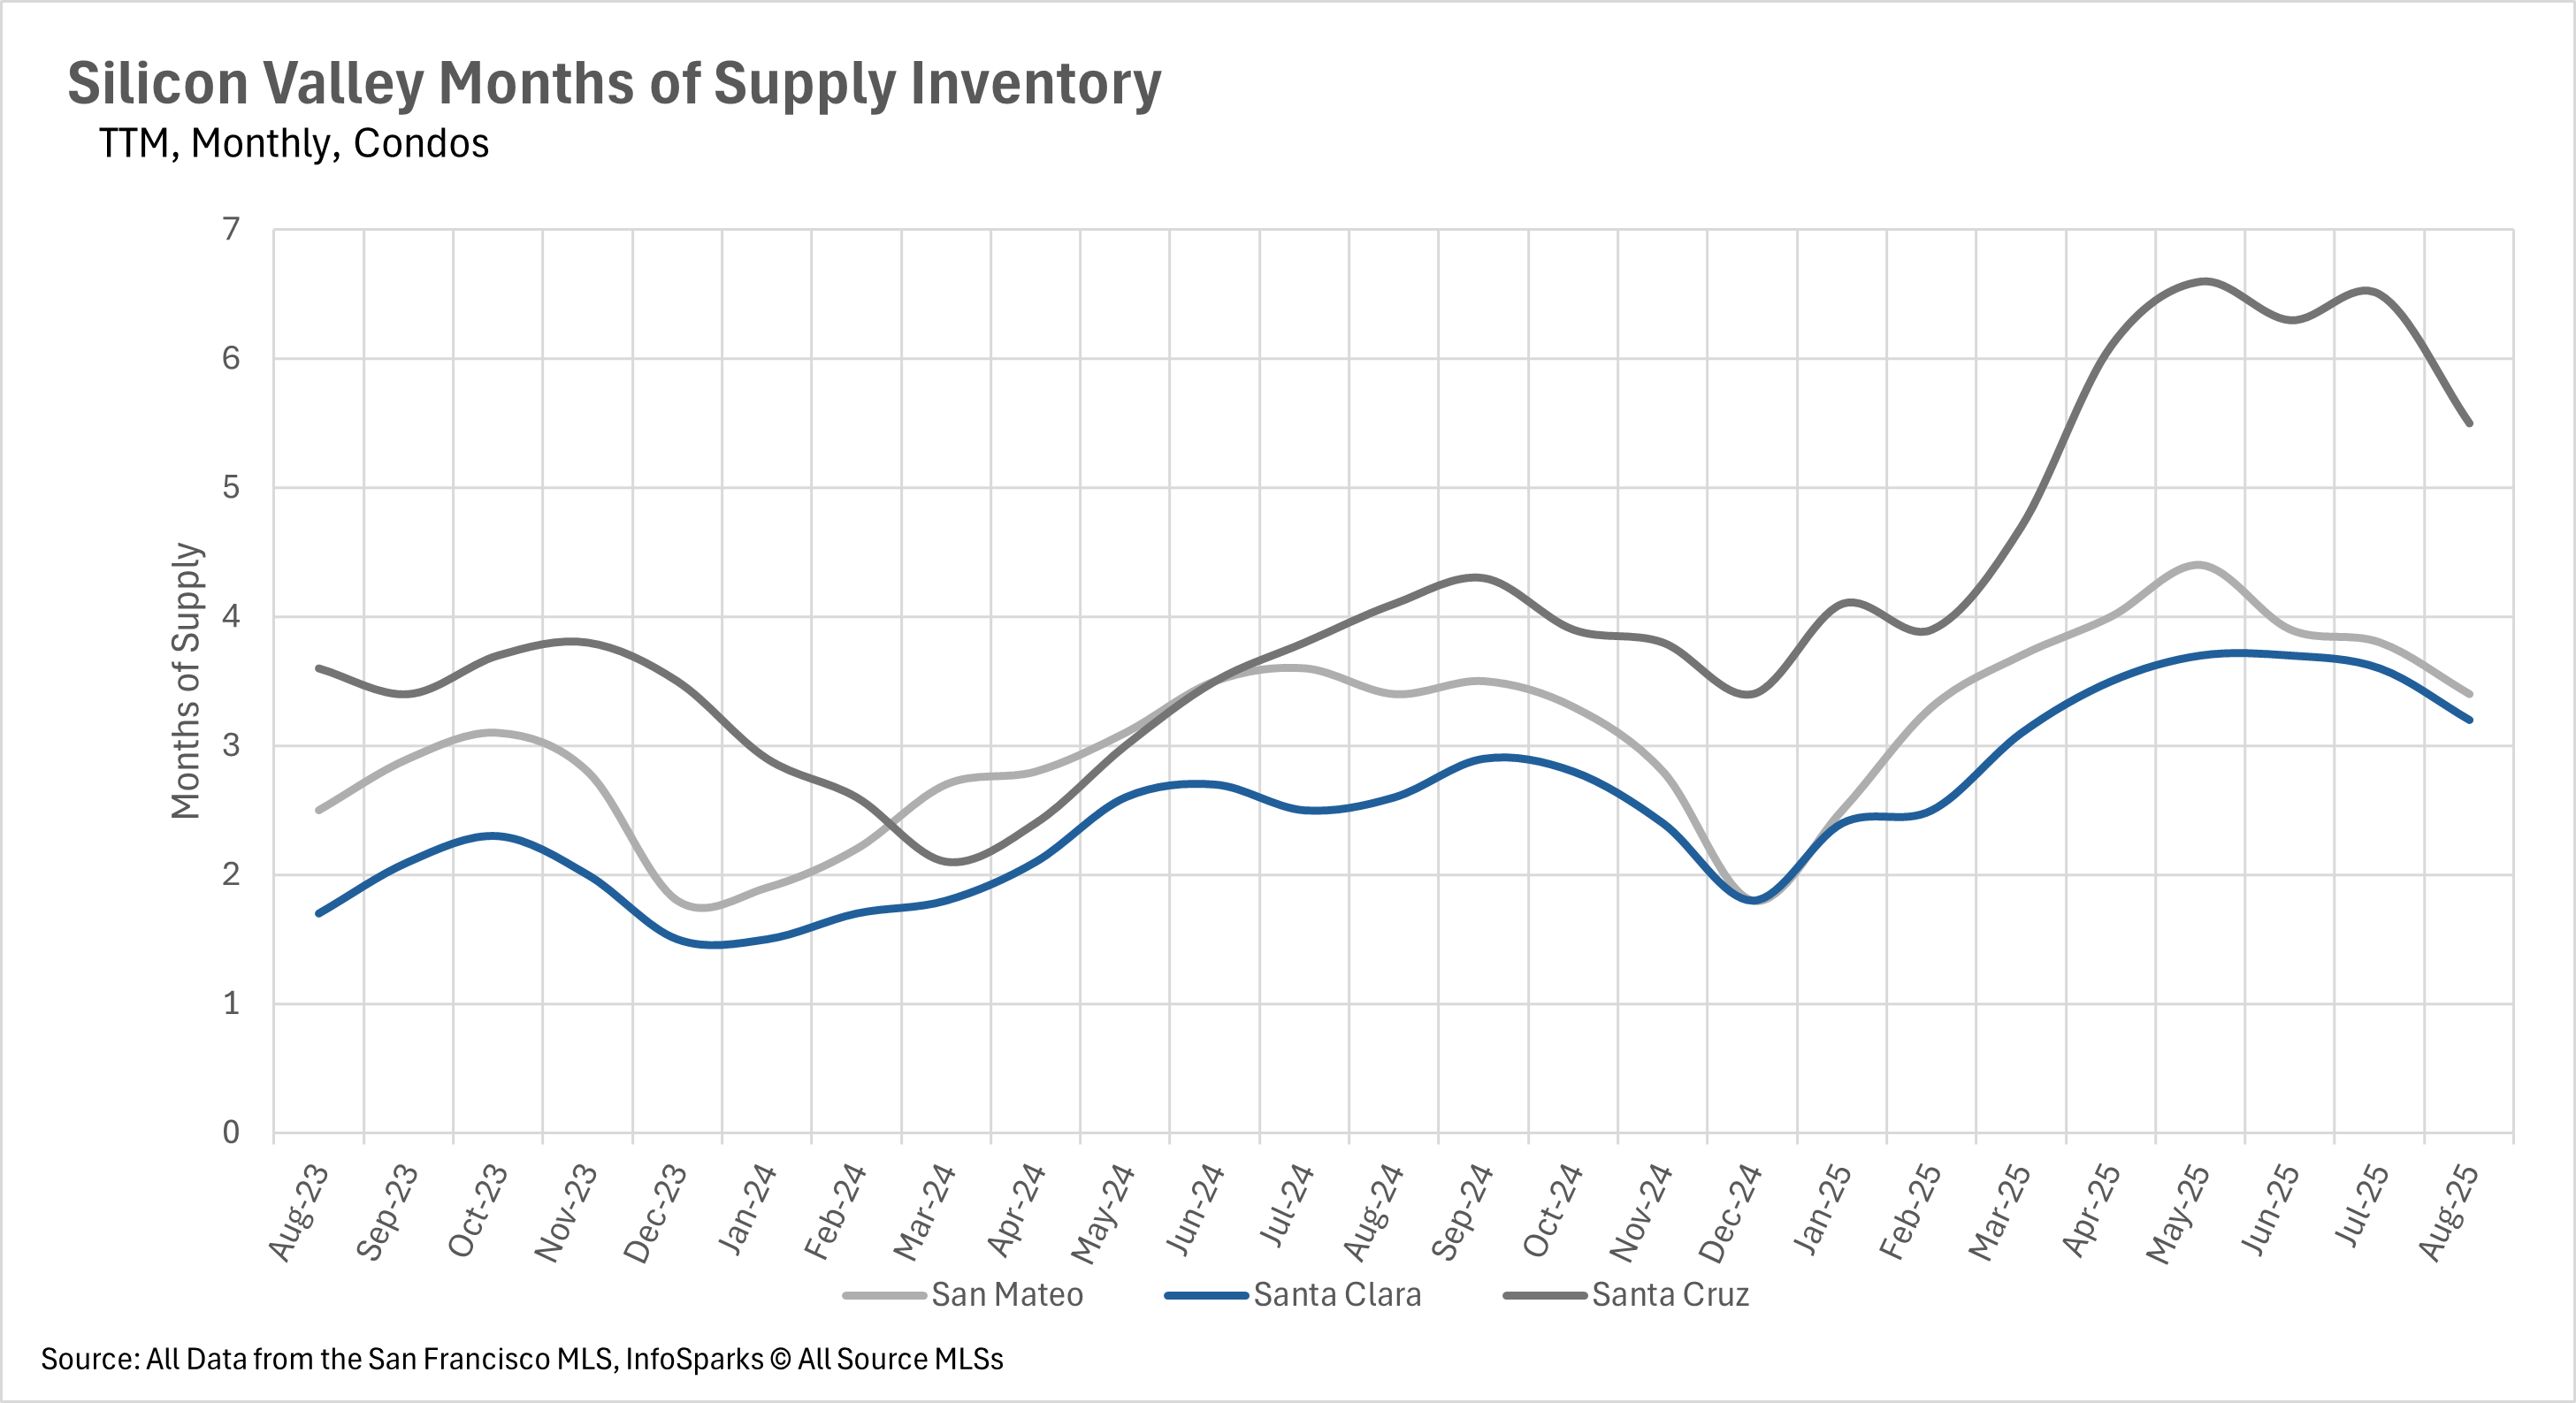
When determining whether a market is a buyers’ market or a sellers’ market, we look to the Months of Supply Inventory (MSI) metric. The state of California has historically averaged around three months of MSI, so any area with at or around three months of MSI is considered a balanced market. Any market that has lower than three months of MSI is considered a seller’s market, whereas markets with more than three months of MSI are considered buyers’ markets.
Few markets are more competitive than the San Mateo and Santa Cruz County single-family markets. These markets have just 1.5 and 1.3 months of inventory, respectively. On the flip side, the Santa Cruz County single-family home market is a buyer's market, with 3.9 months of inventory on the market. Likewise, the entire condo market is a buyer's market, with 3.4 months of inventory on the market in San Mateo County, 3.2 months in Santa Clara County, and 5.5 months in Santa Cruz County.
Stay up to date on the latest real estate trends.

Real Estate 101 | Woodside

Market Update

Real Estate 101 | Palo Alto

Real Estate 101 | Atherton

Real Estate 101 | Menlo Park

Real Estate 101 | Menlo Park
We know that real estate transactions can be complex, but with our expertise, they don’t have to be stressful. Our team is dedicated to handling every aspect of your Mid-Peninsula real estate needs with the utmost care and professionalism. From the initial consultation to the closing, we manage all the details so you can focus on your future. Whatever challenges arise, trust that we’ve got this — your success is our top priority.