Silicon Valley Is Slowly Becoming a Buyers’ Market
Nationwide Data David Weil June 18, 2025
Nationwide Data David Weil June 18, 2025
Note: You can find the charts & graphs for the Big Story at the end of the following section.
*National Association of REALTORS® data is released two months behind, so we estimate the most recent month’s data when possible and appropriate.
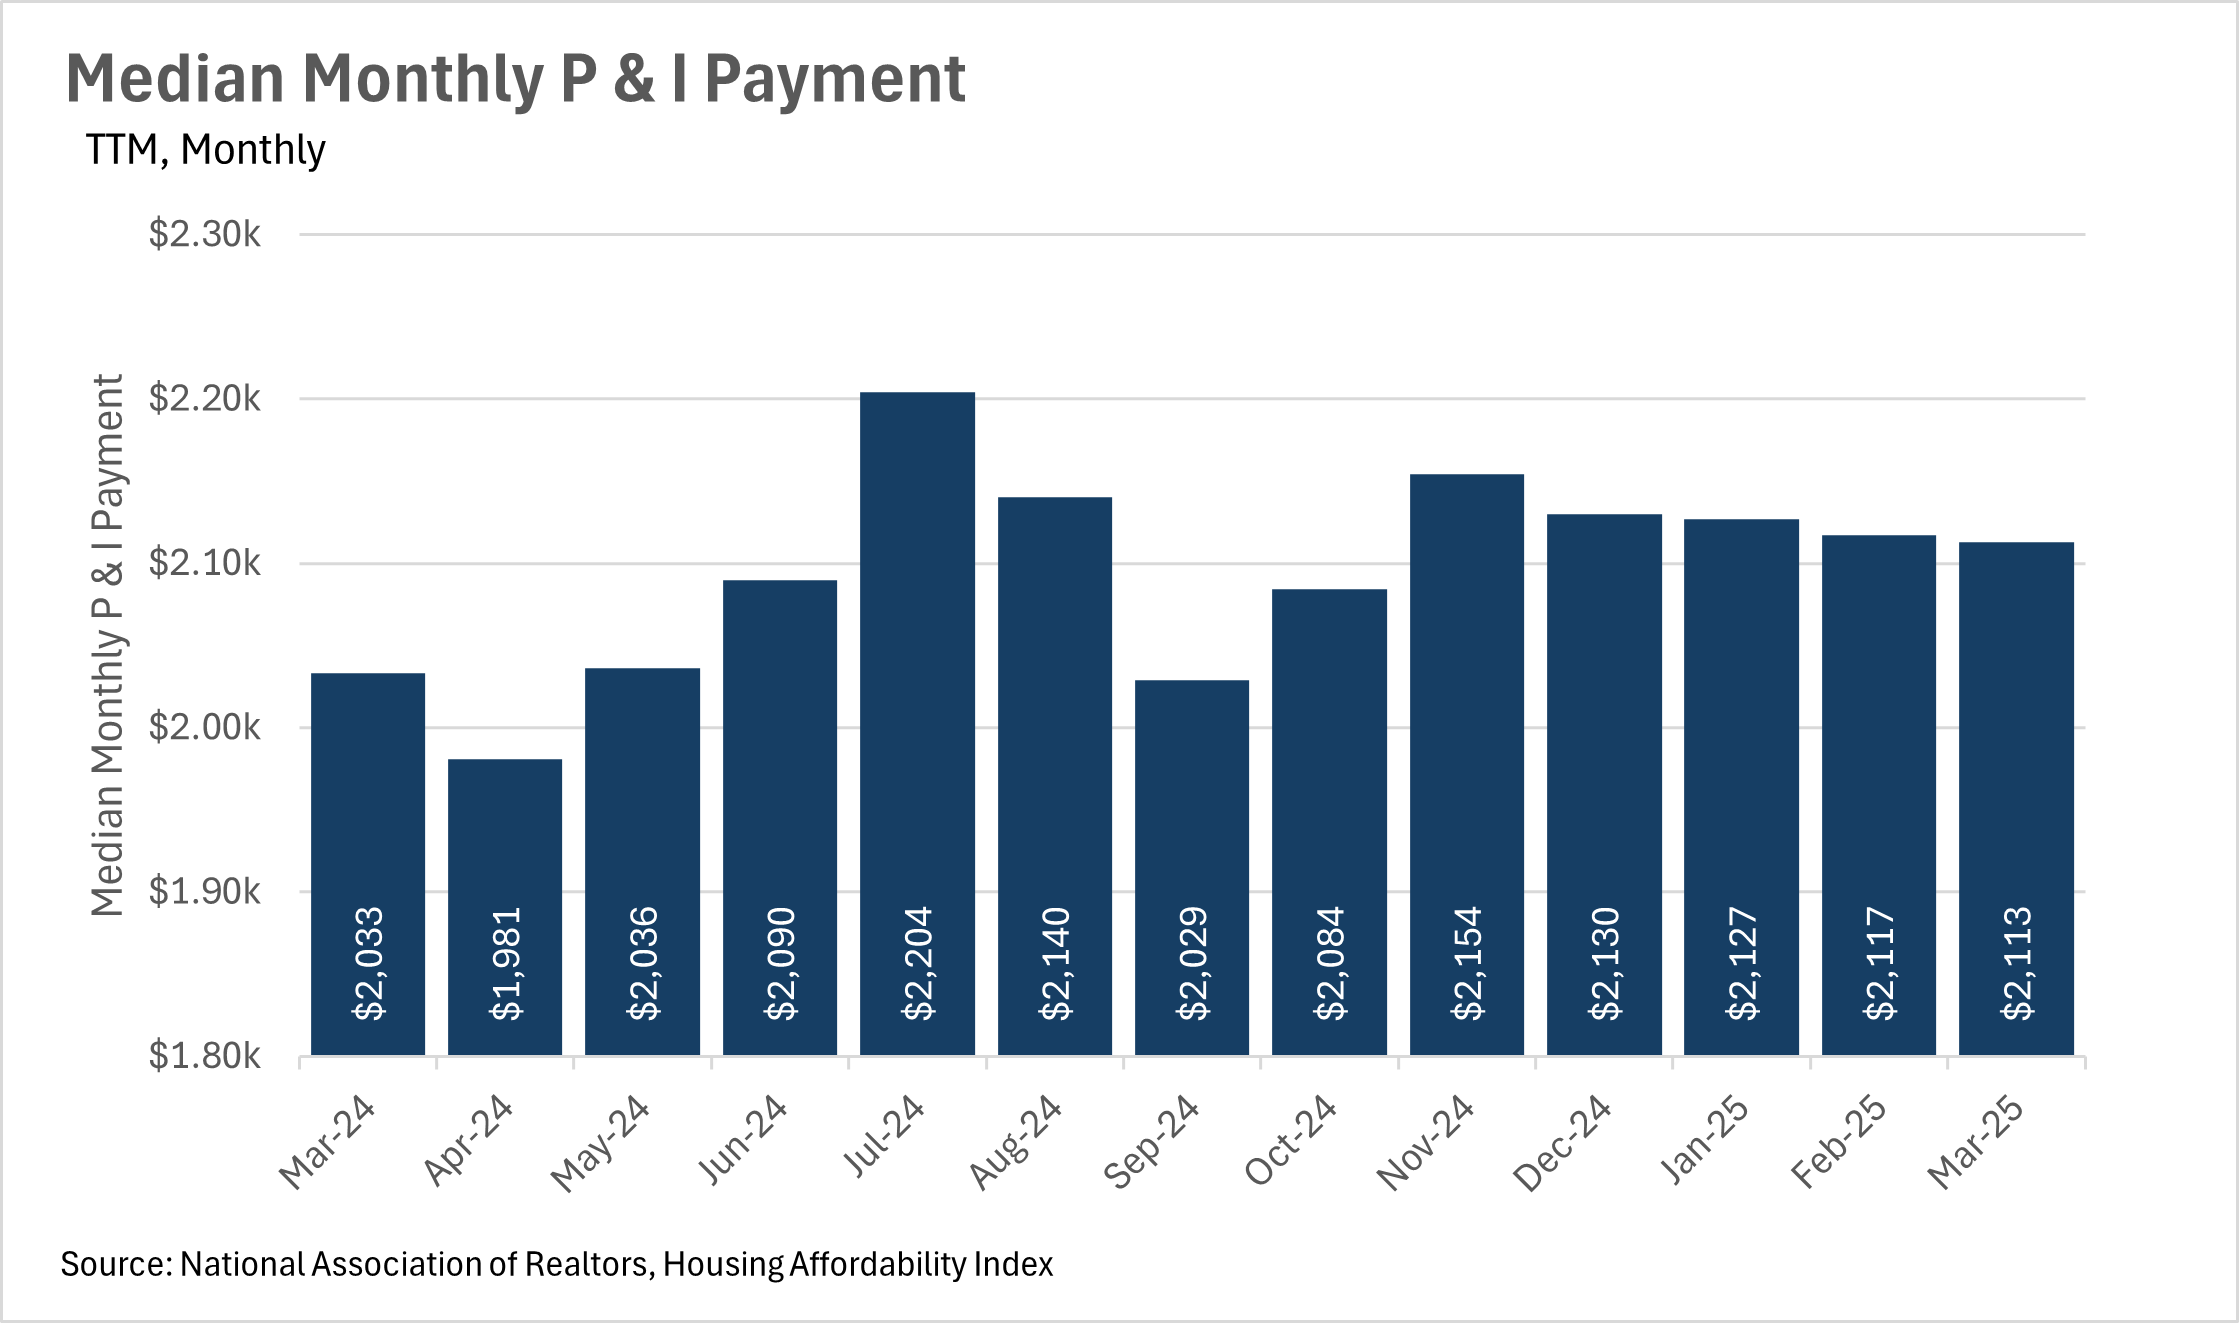
For quite some time, we’ve seen monthly inflation readouts with figures in the 2-3% range. Despite the fact that inflation seems to be under wraps for now, the median monthly P&I payment has grown faster than inflation, with the most reading coming in at $2,113, representing a 3.94% increase on a year-over-year basis. This shows that there are still inflationary pressures at work in the housing market.
Factors contributing to this inflation will vary by market. Some markets have more of an issue on the supply side (i.e. higher construction/materials costs), while others have an issue with the demand side (i.e. more demand for homes than supply). It will be especially important to pay attention to this metric over the coming months to get a gauge of how inflation is impacting the housing market.
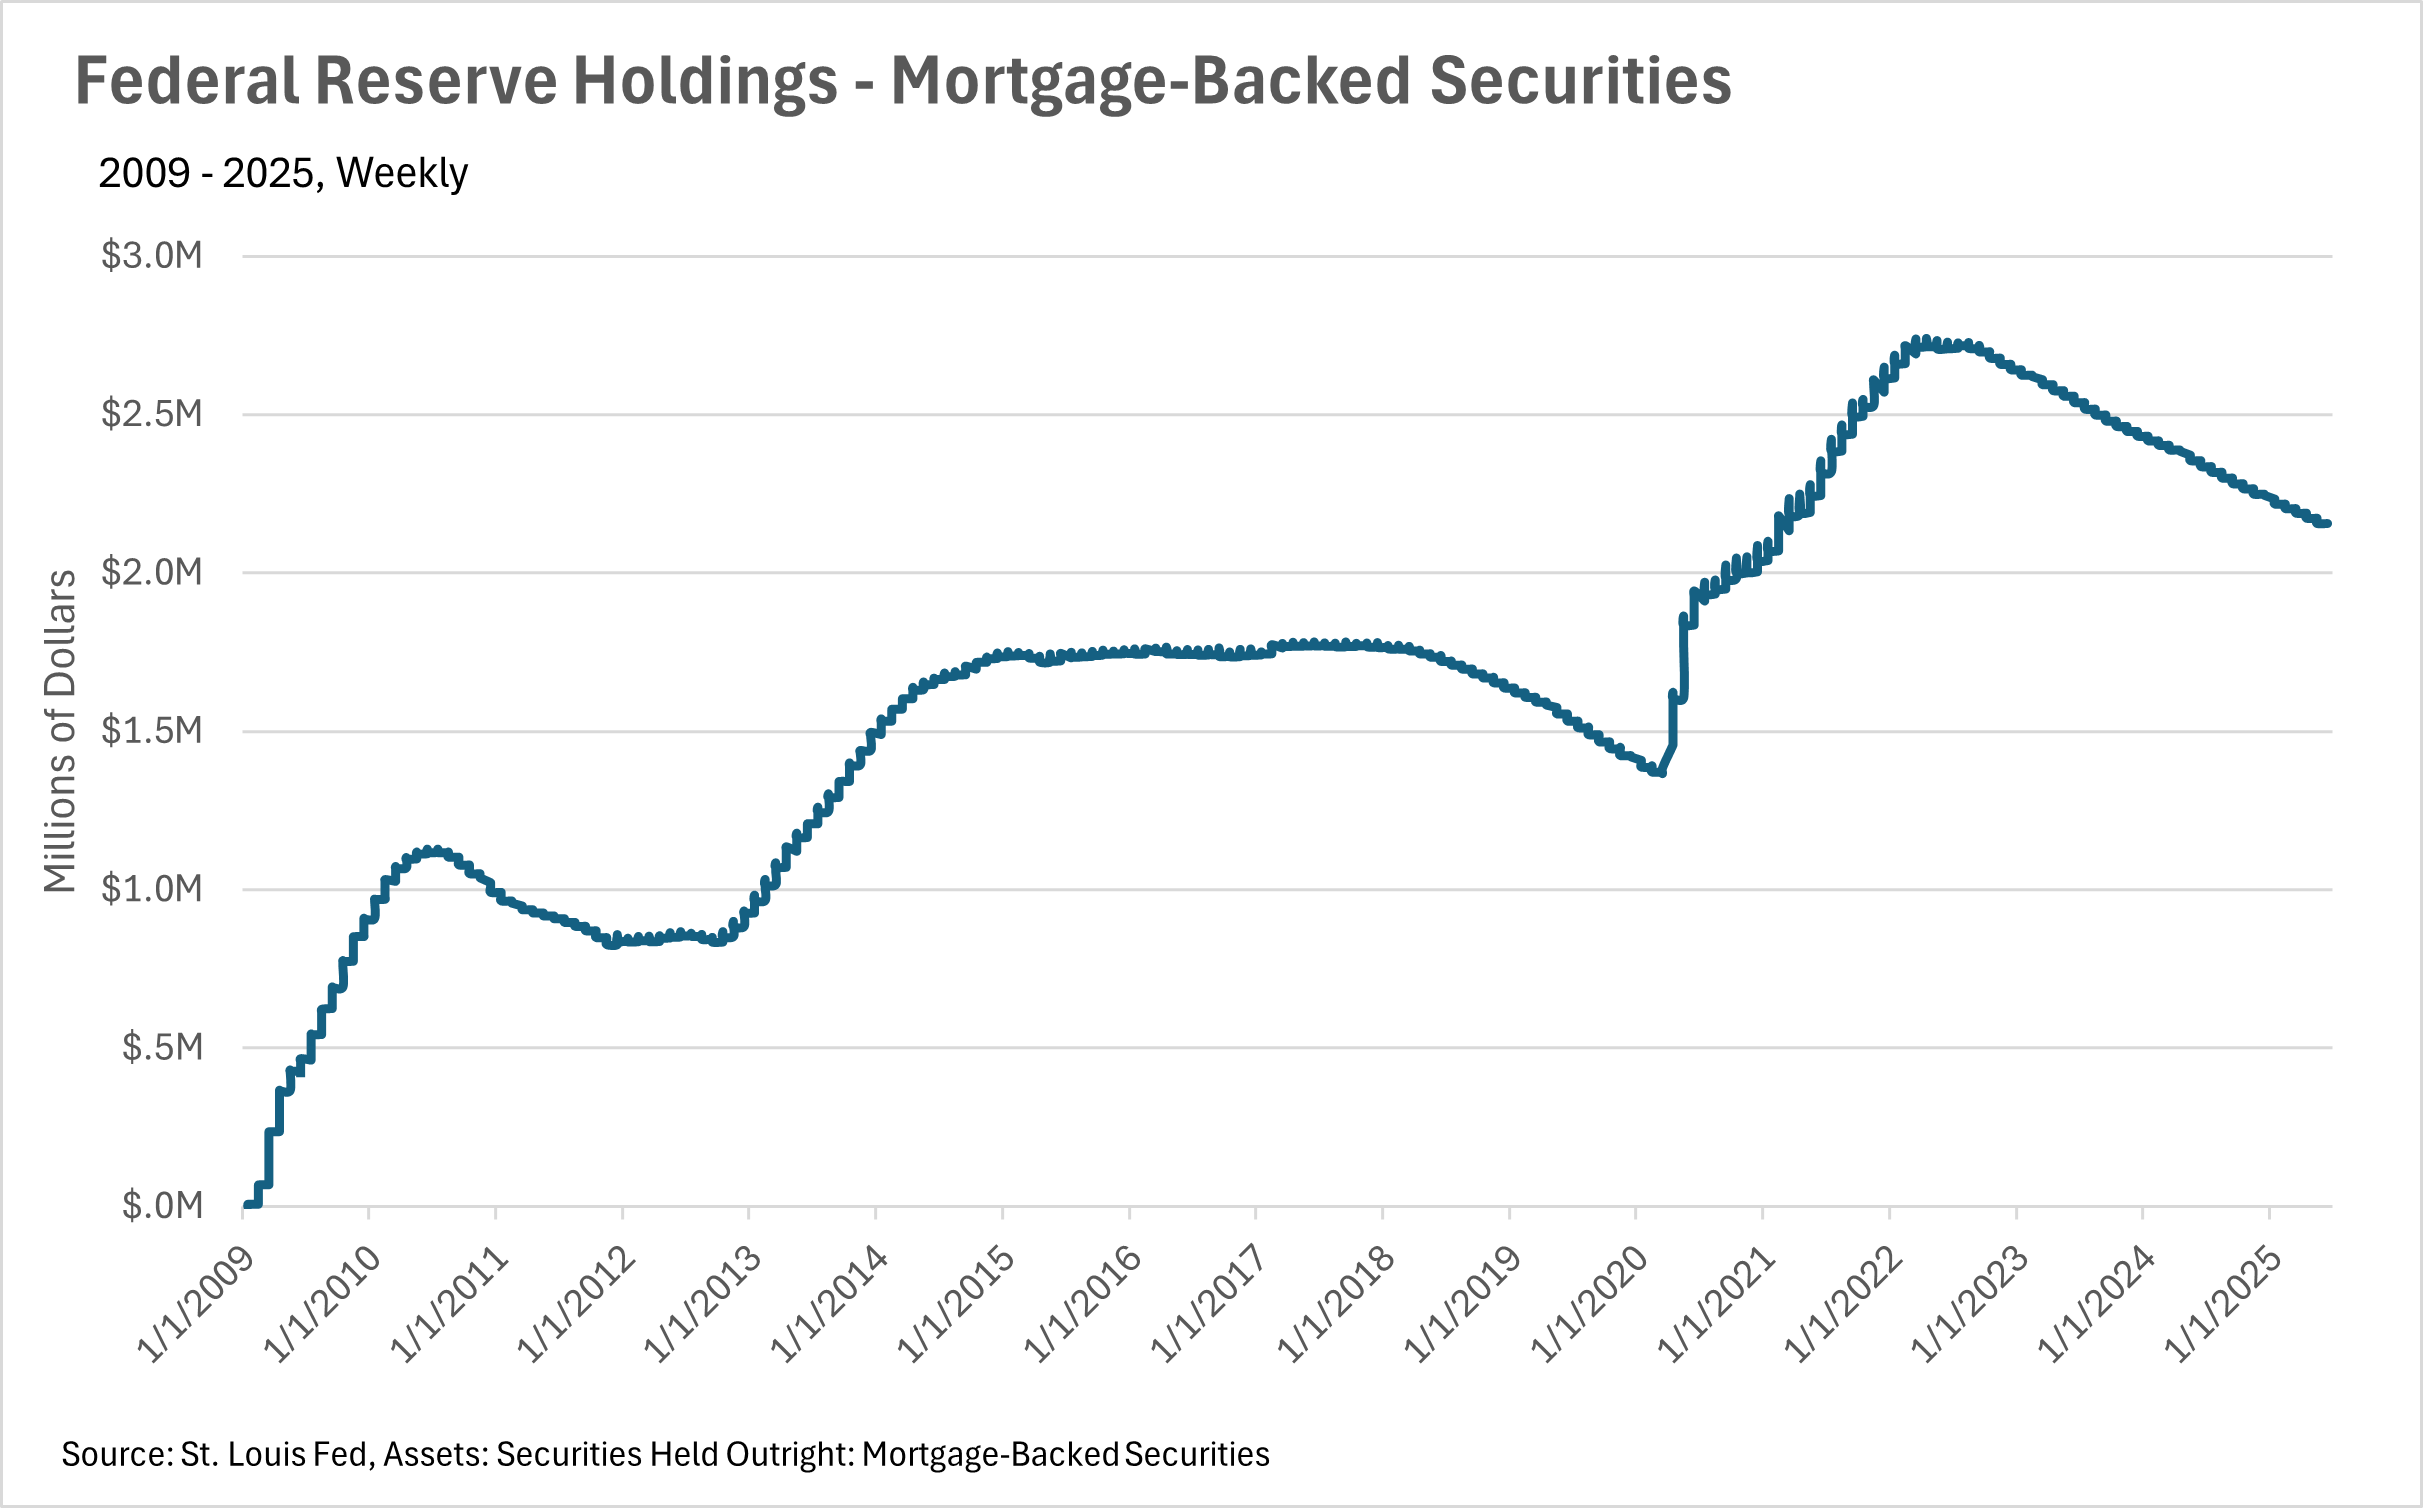
Mortgage rates have remained high, in the mid to high-6% range for quite some time. Some believe that the recent trade war was being implemented in part to bring down interest rates. However, judging by recent commentary from the Fed, the trade war and the associated uncertainty, has only made Fed officials more cautious in utilizing the incredibly powerful economic tool that is the federal funds rate.
This means that we are probably going to see elevated mortgage rates for the foreseeable future, unless the economy takes a considerable turn for the worse. It is worth noting though, that according to the Fed’s “Dot Plot”, the majority of Federal Reserve officials predict the federal funds rate will be in the 3.75-4.00% range by the end of the year, and the 3.25-3.50% range in 2026.
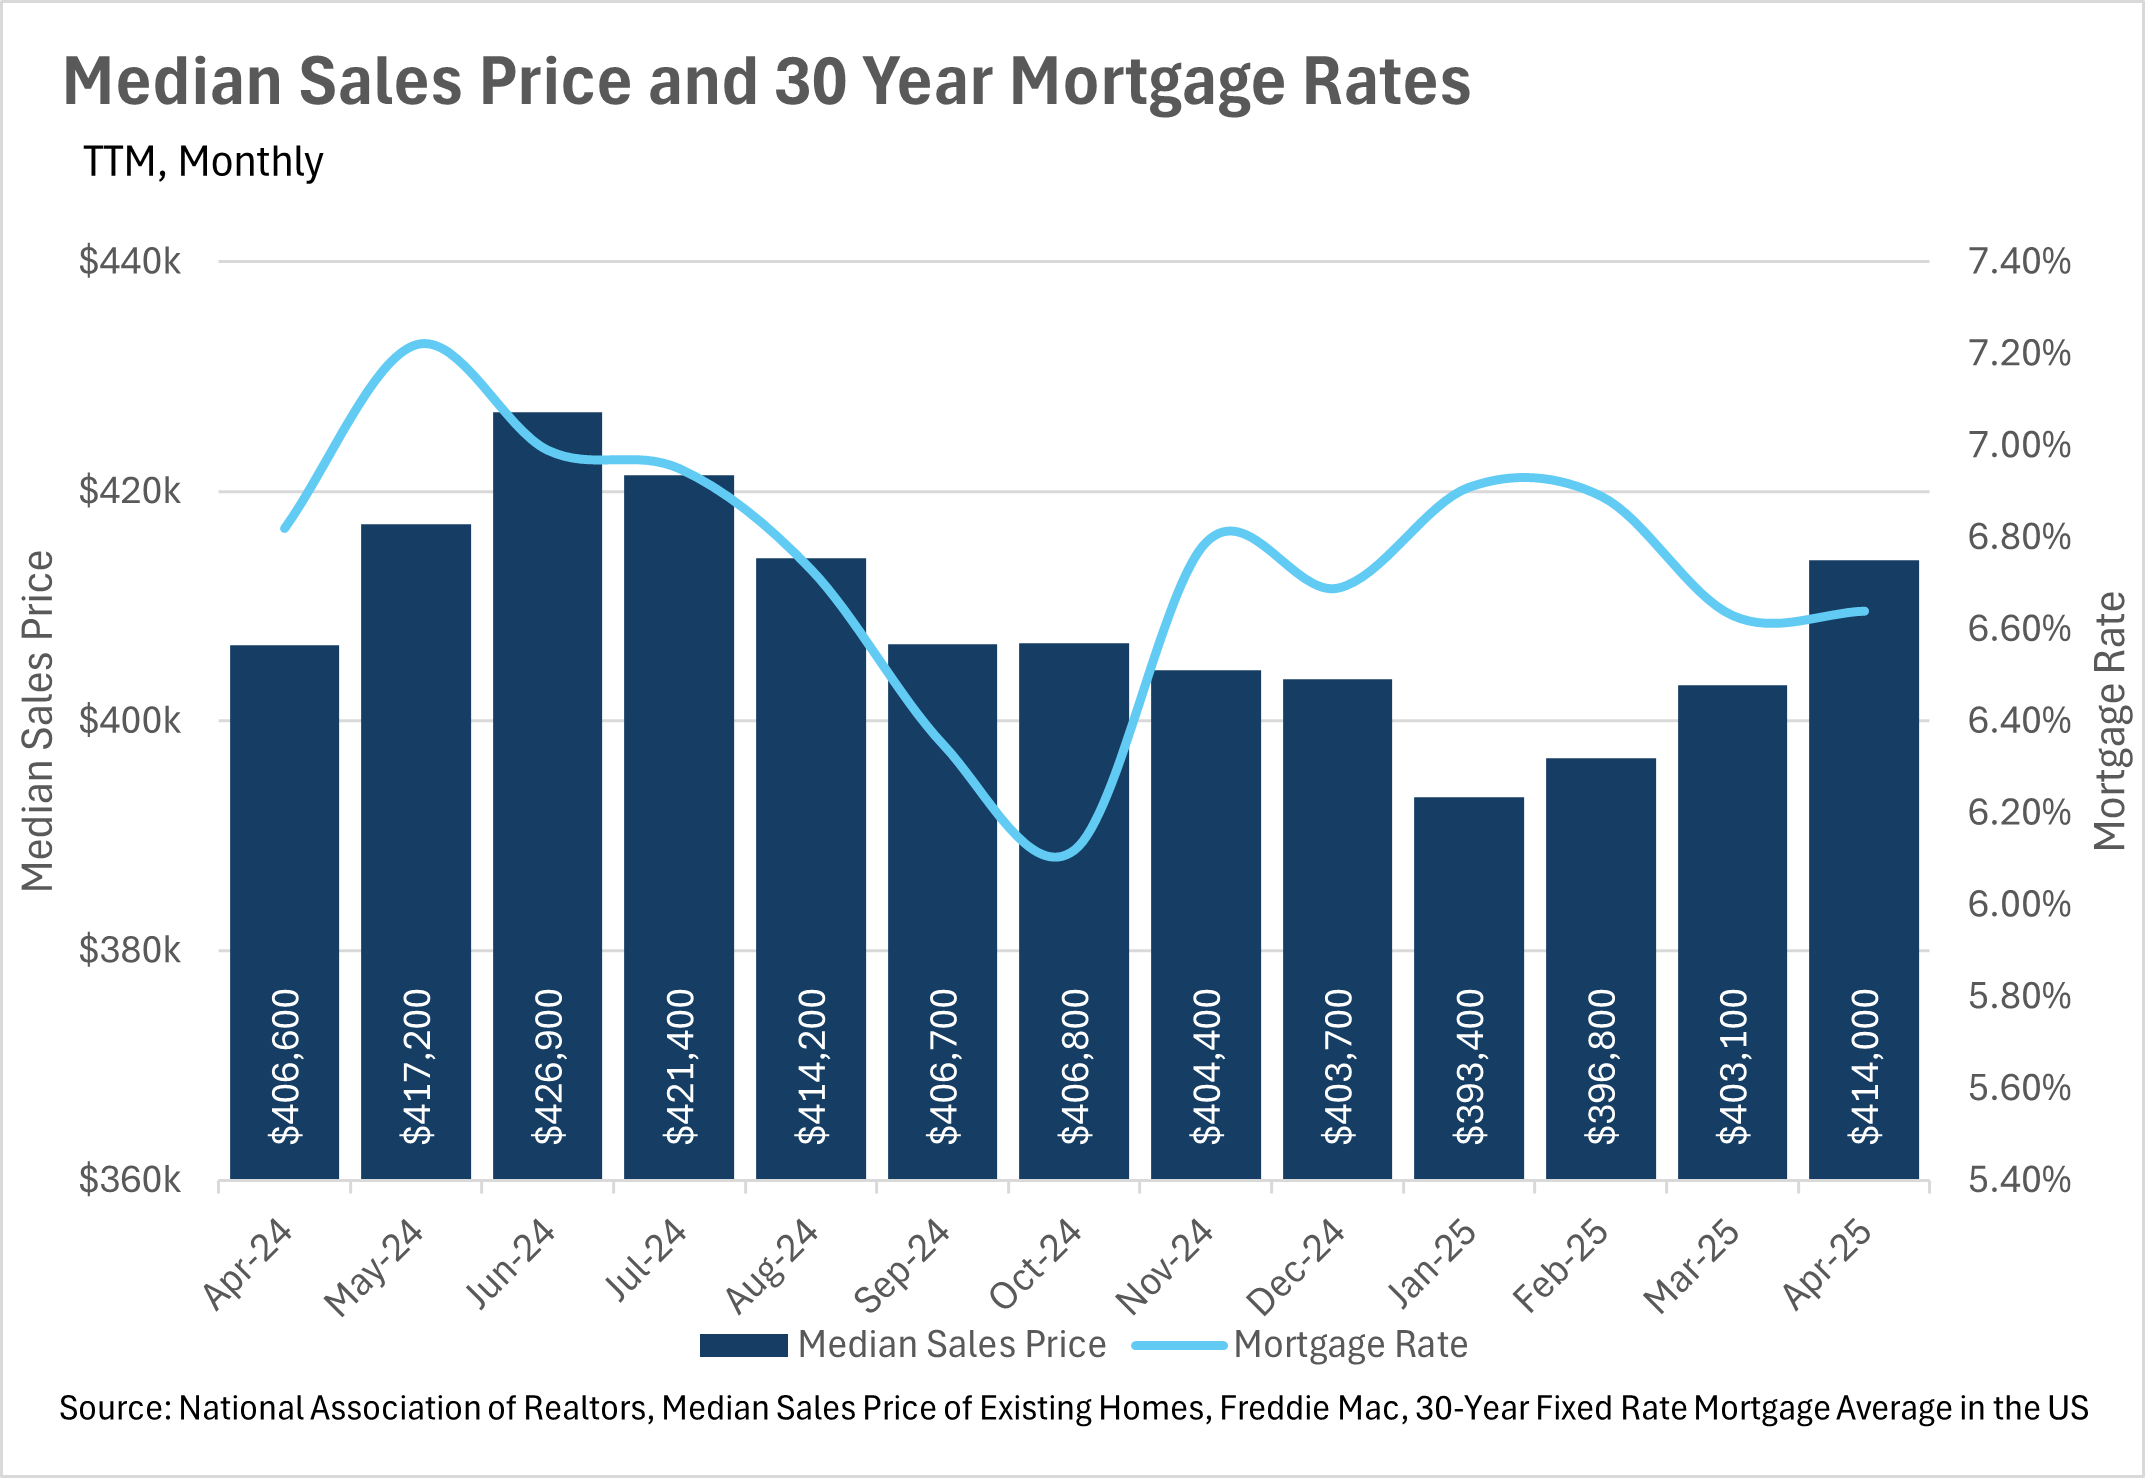
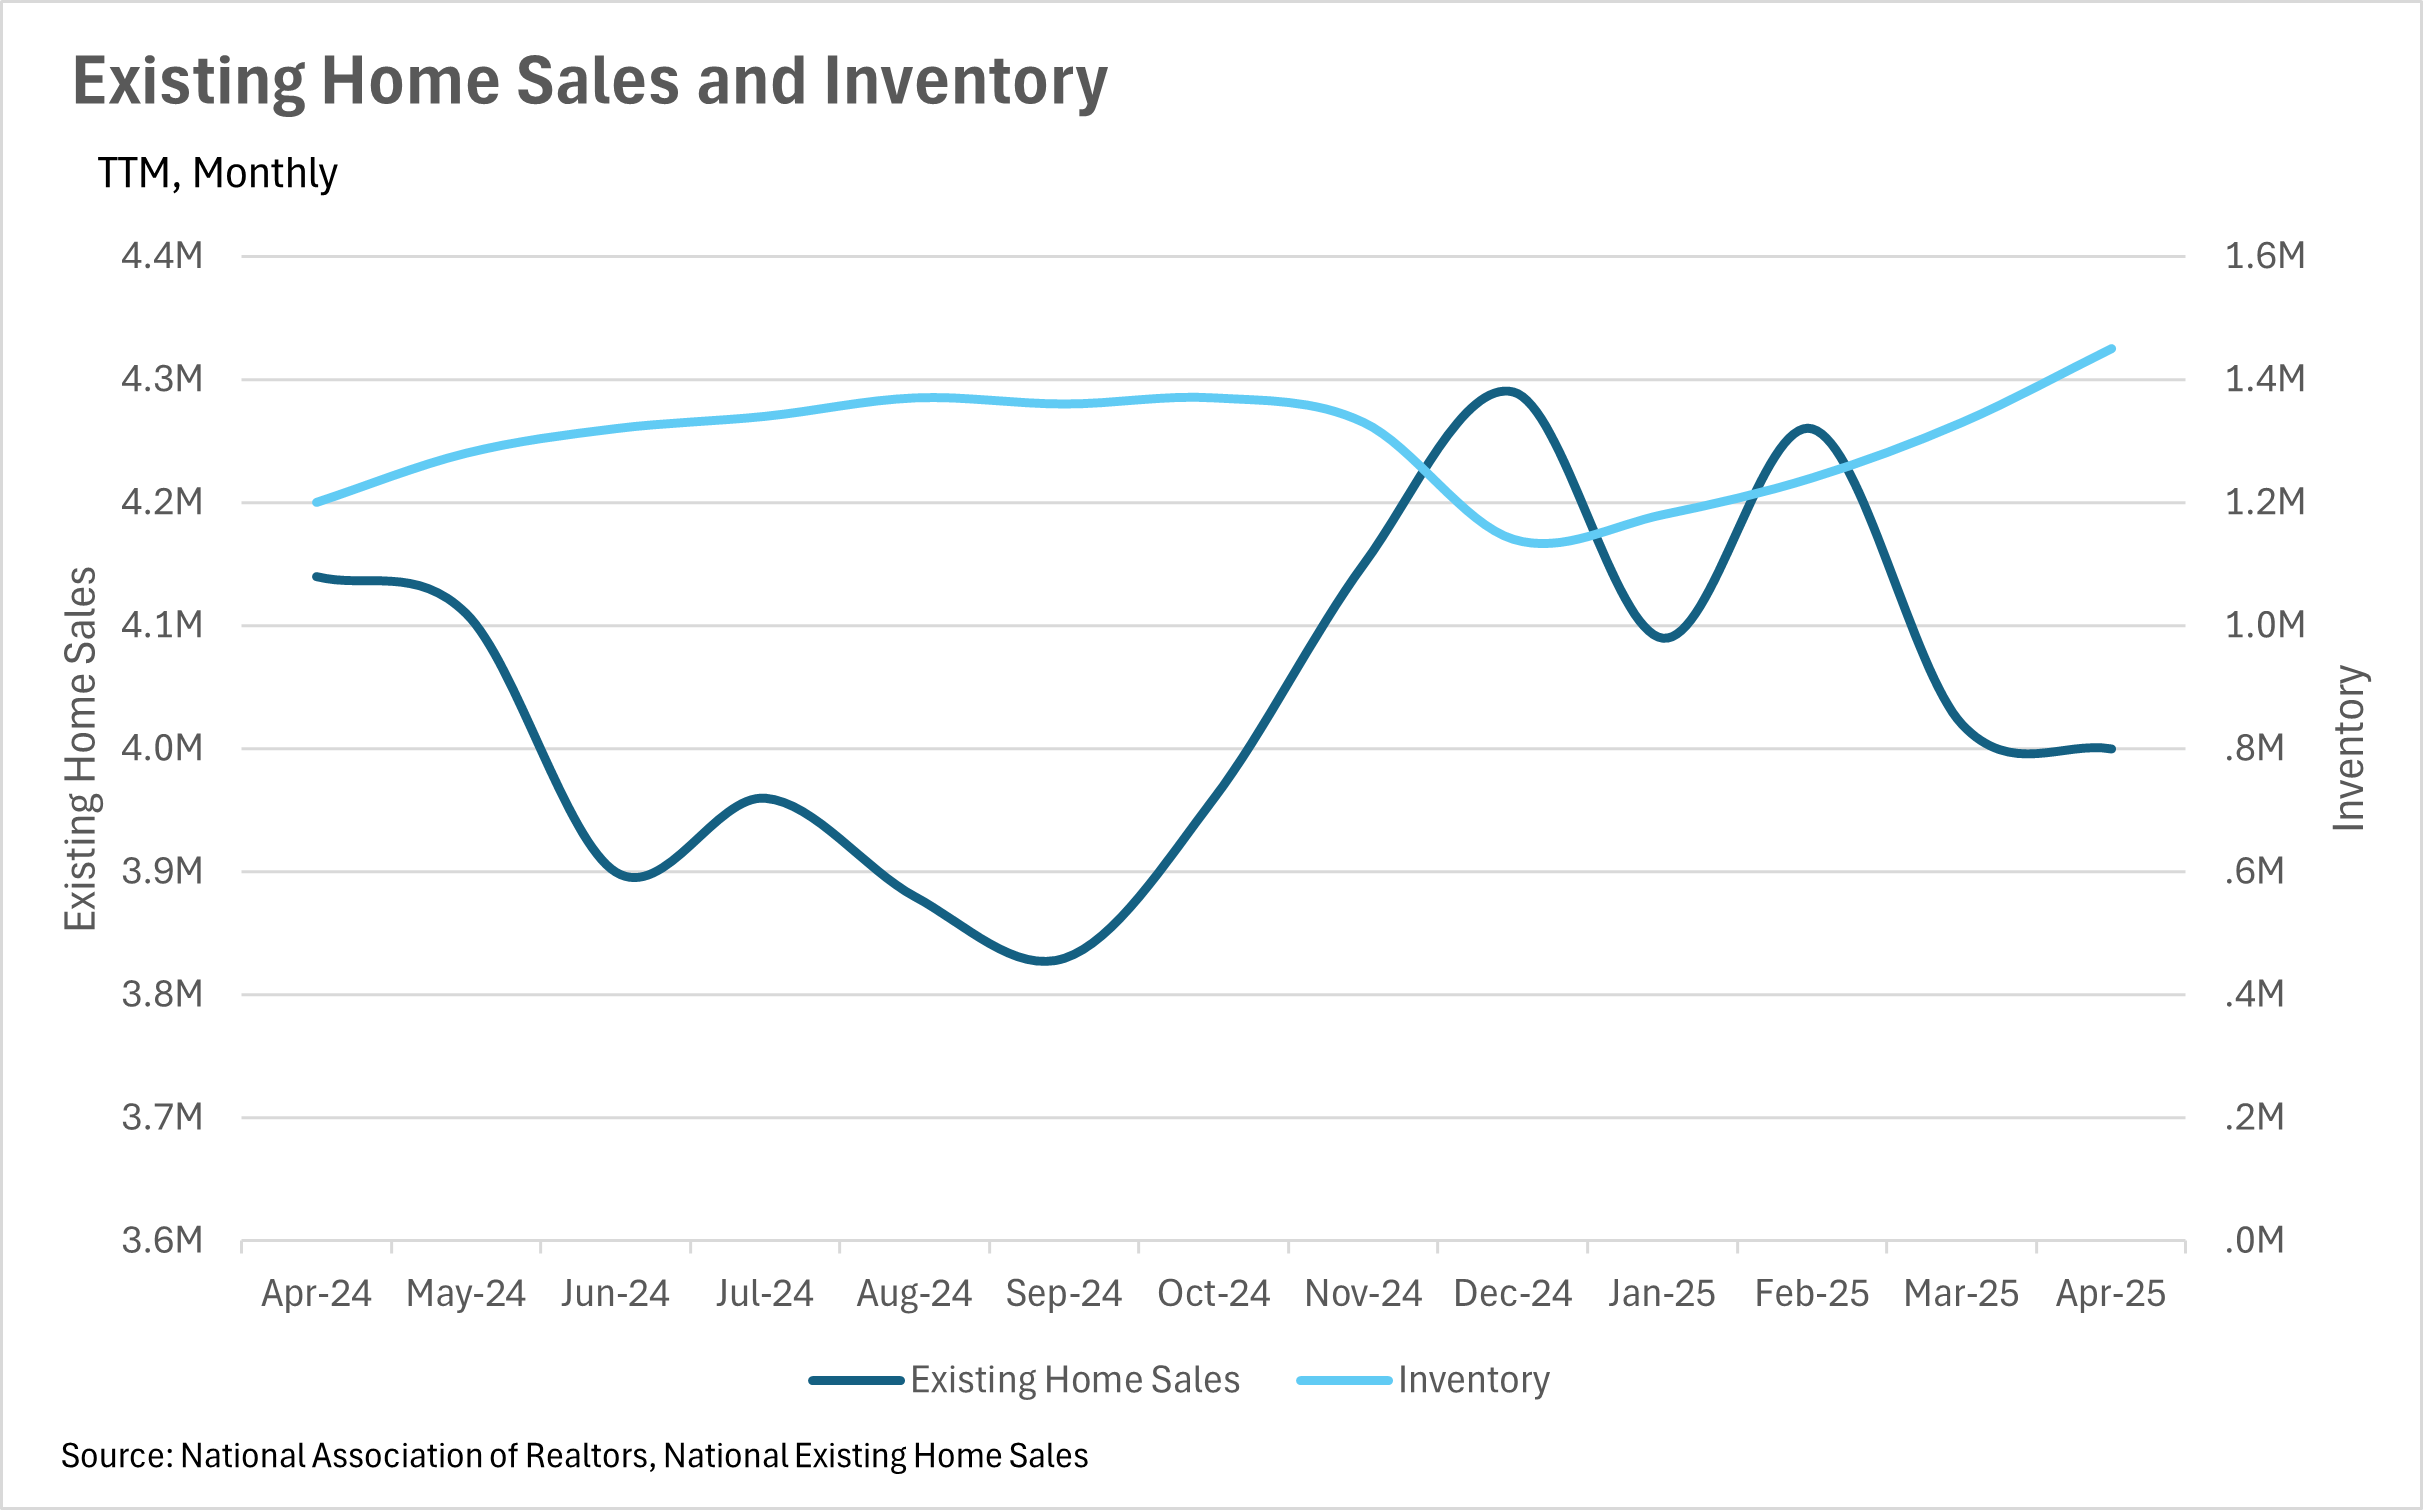
The moves in sales and inventory that we’ve been seeing throughout California over the past few months have been echoed on a national scale. The nation as a whole has seen inventories build, as homes sit on the market for longer. Our most recent data point (April 2025), shows that inventory increased by 20.83% on a year-over-year basis, to 1,450,000. Meanwhile, existing home sales decreased by 3.38%, to 4,000,000.
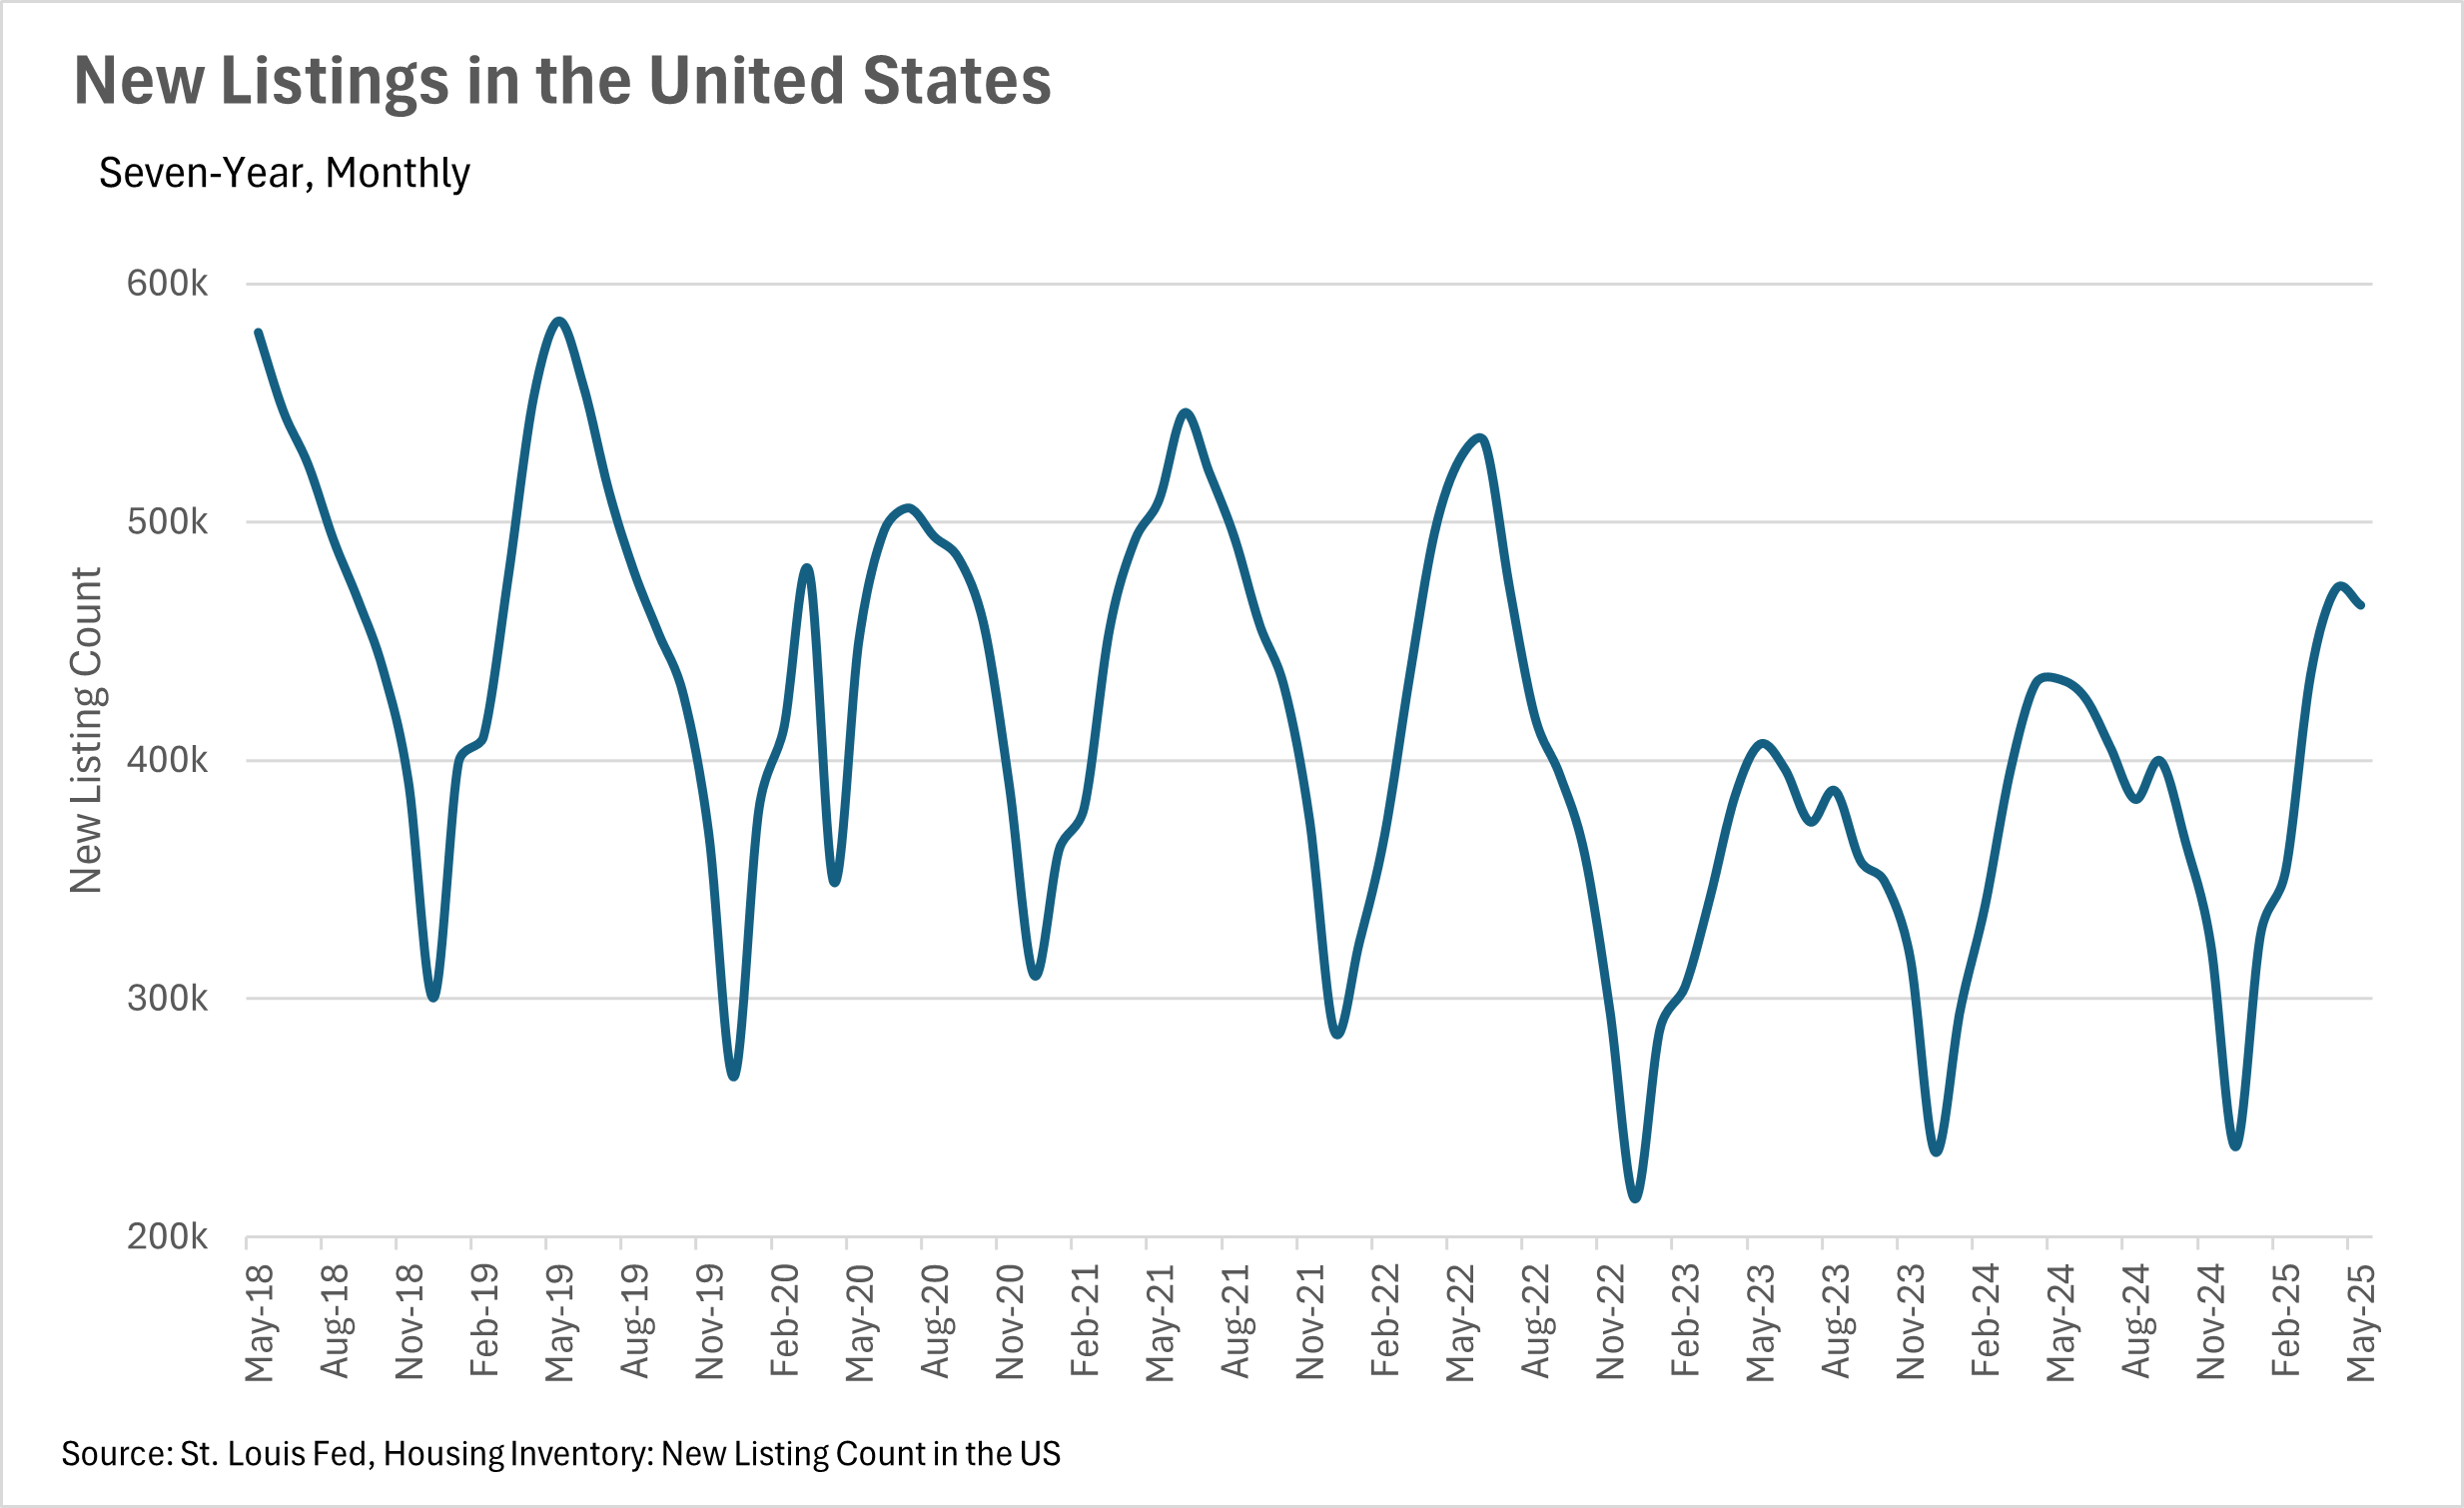
Despite the growing backlog of inventory, median sale prices are still trending upward, with the median listing selling for $414,000, representing a 1.82% year-over-year increase. To add fuel to the fire, we’ve seen growing numbers of listings hitting the market, with the number of new listings hitting the market increasing by 7.19% on a year-over-year basis.
Ultimately though, this is just what we’re seeing at a national level. As we all know, real estate is an incredibly localized industry, so knowing what’s going on in your own market is pivotal. Below is our local lowdown, that outlines everything you need to know about what’s happening around you in your neighborhood and surrounding areas!
Note: You can find the charts/graphs for the Local Lowdown at the end of this section.
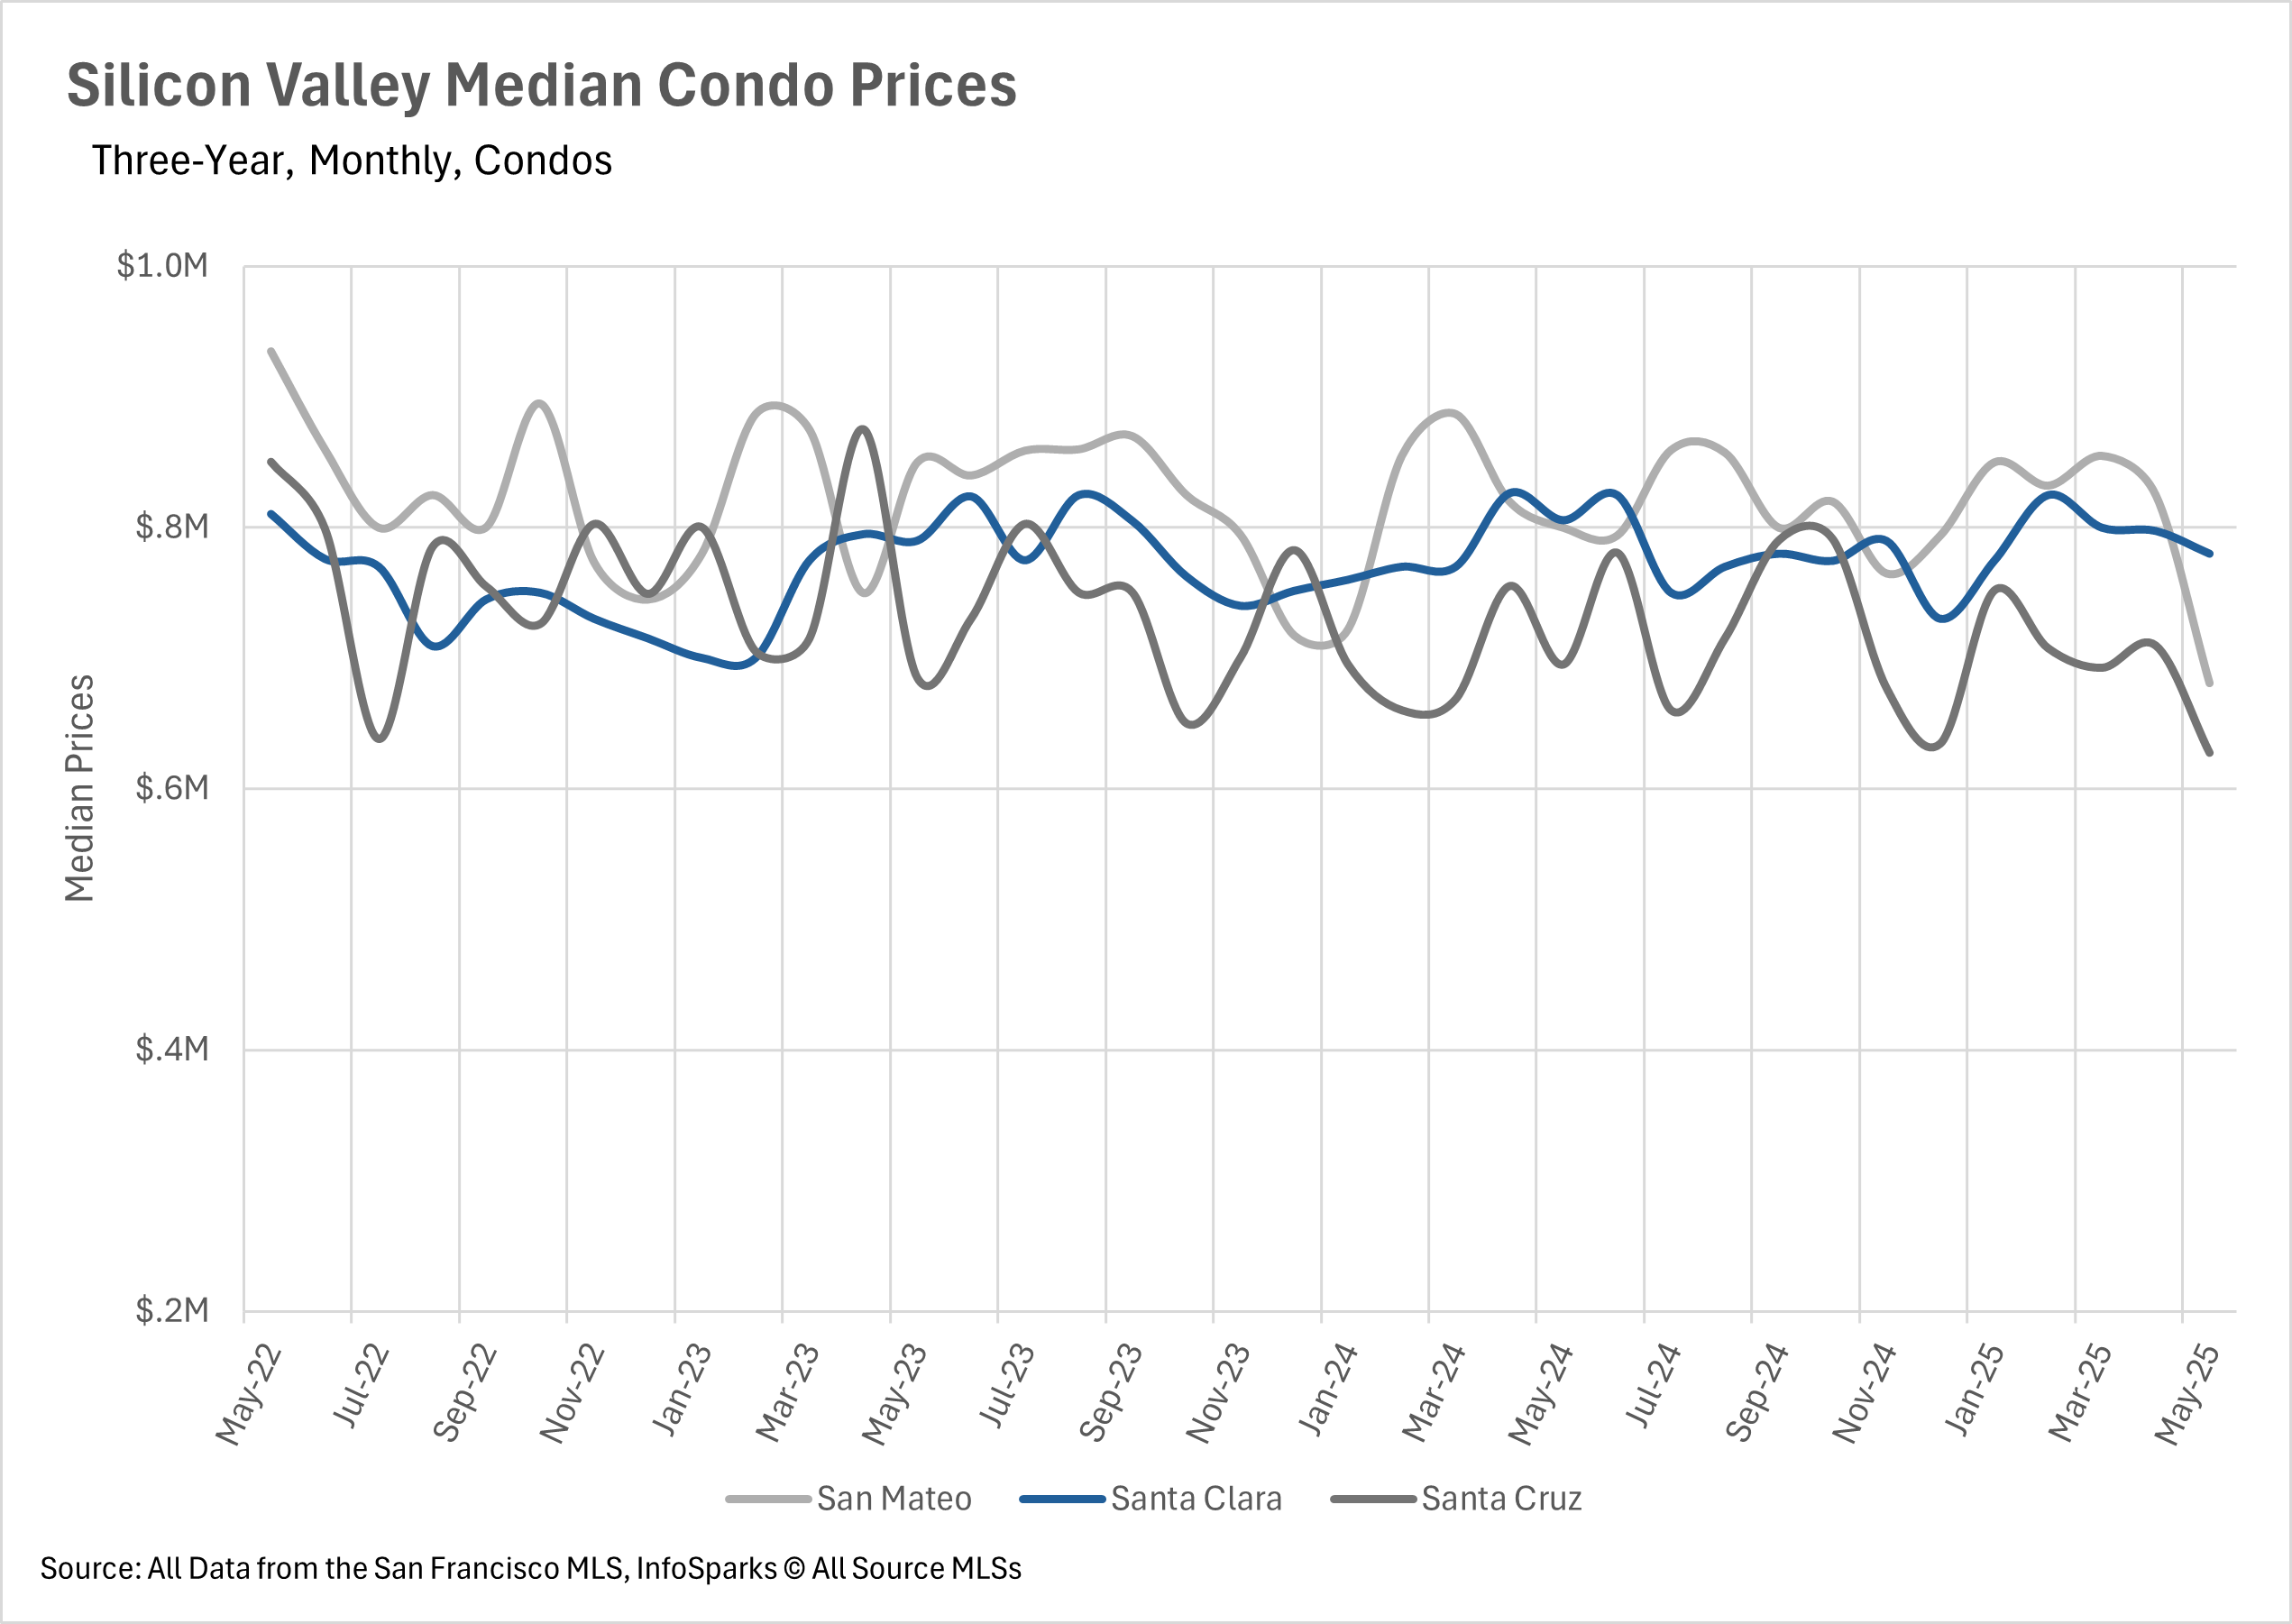
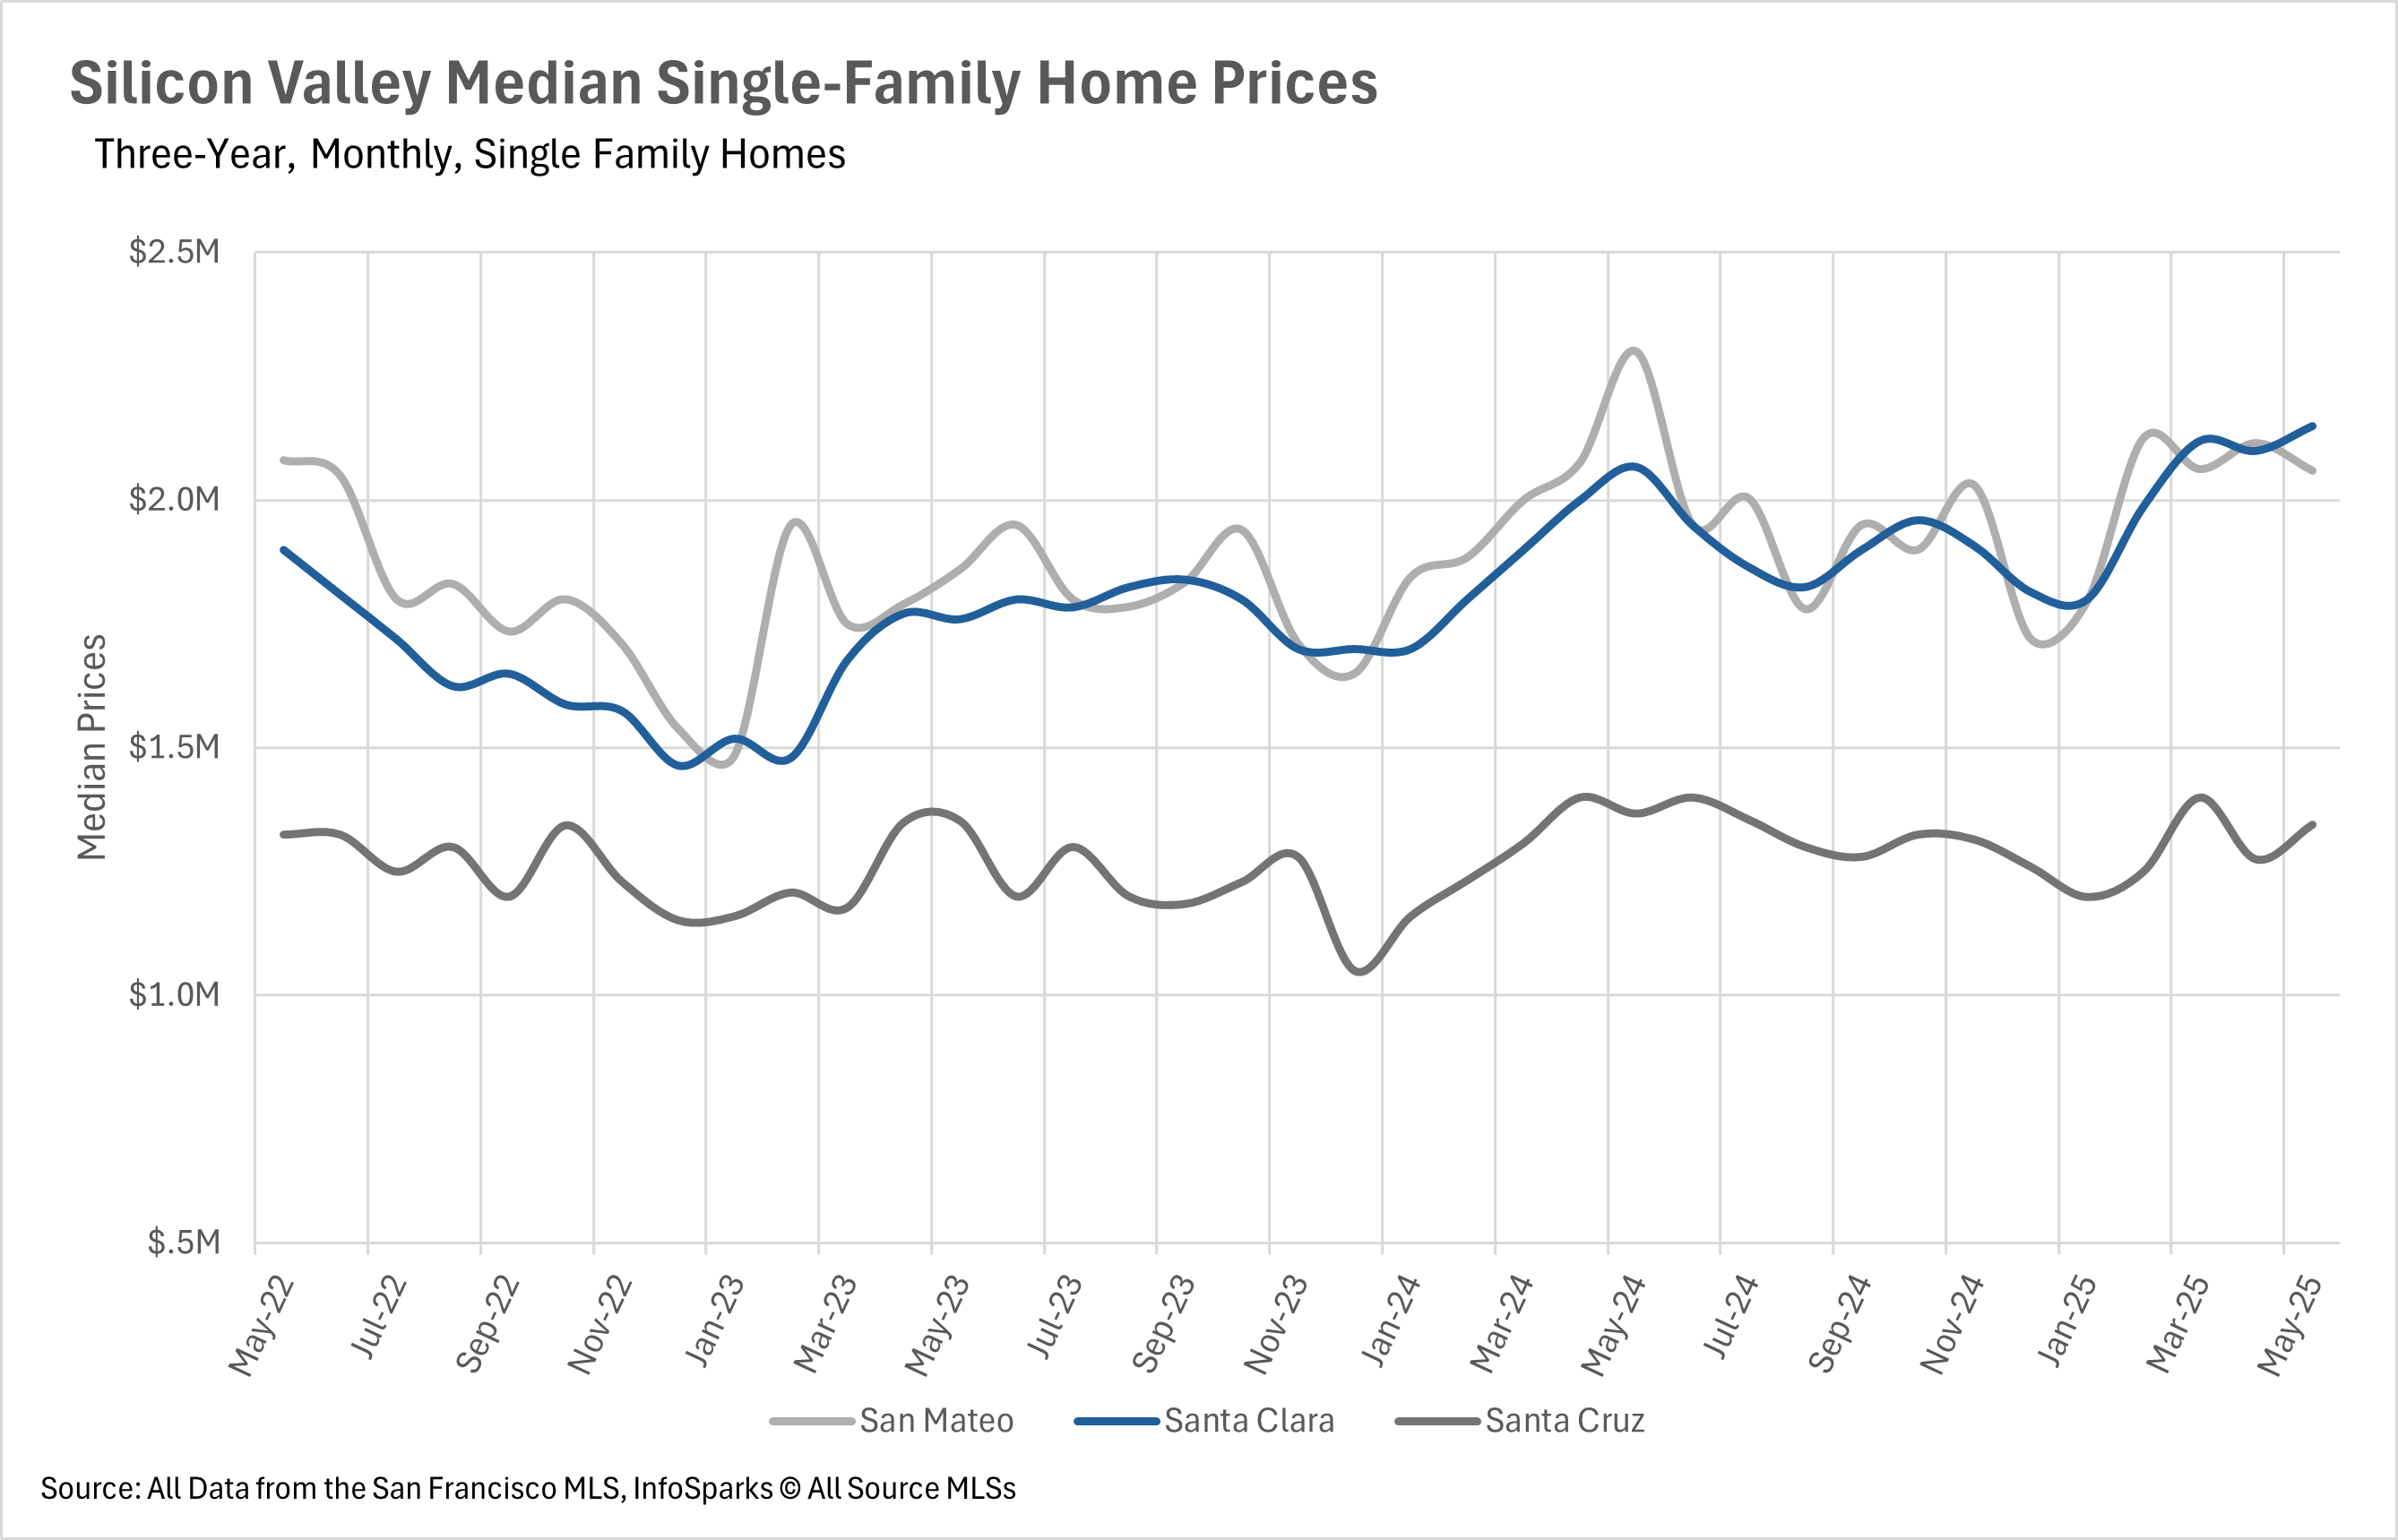
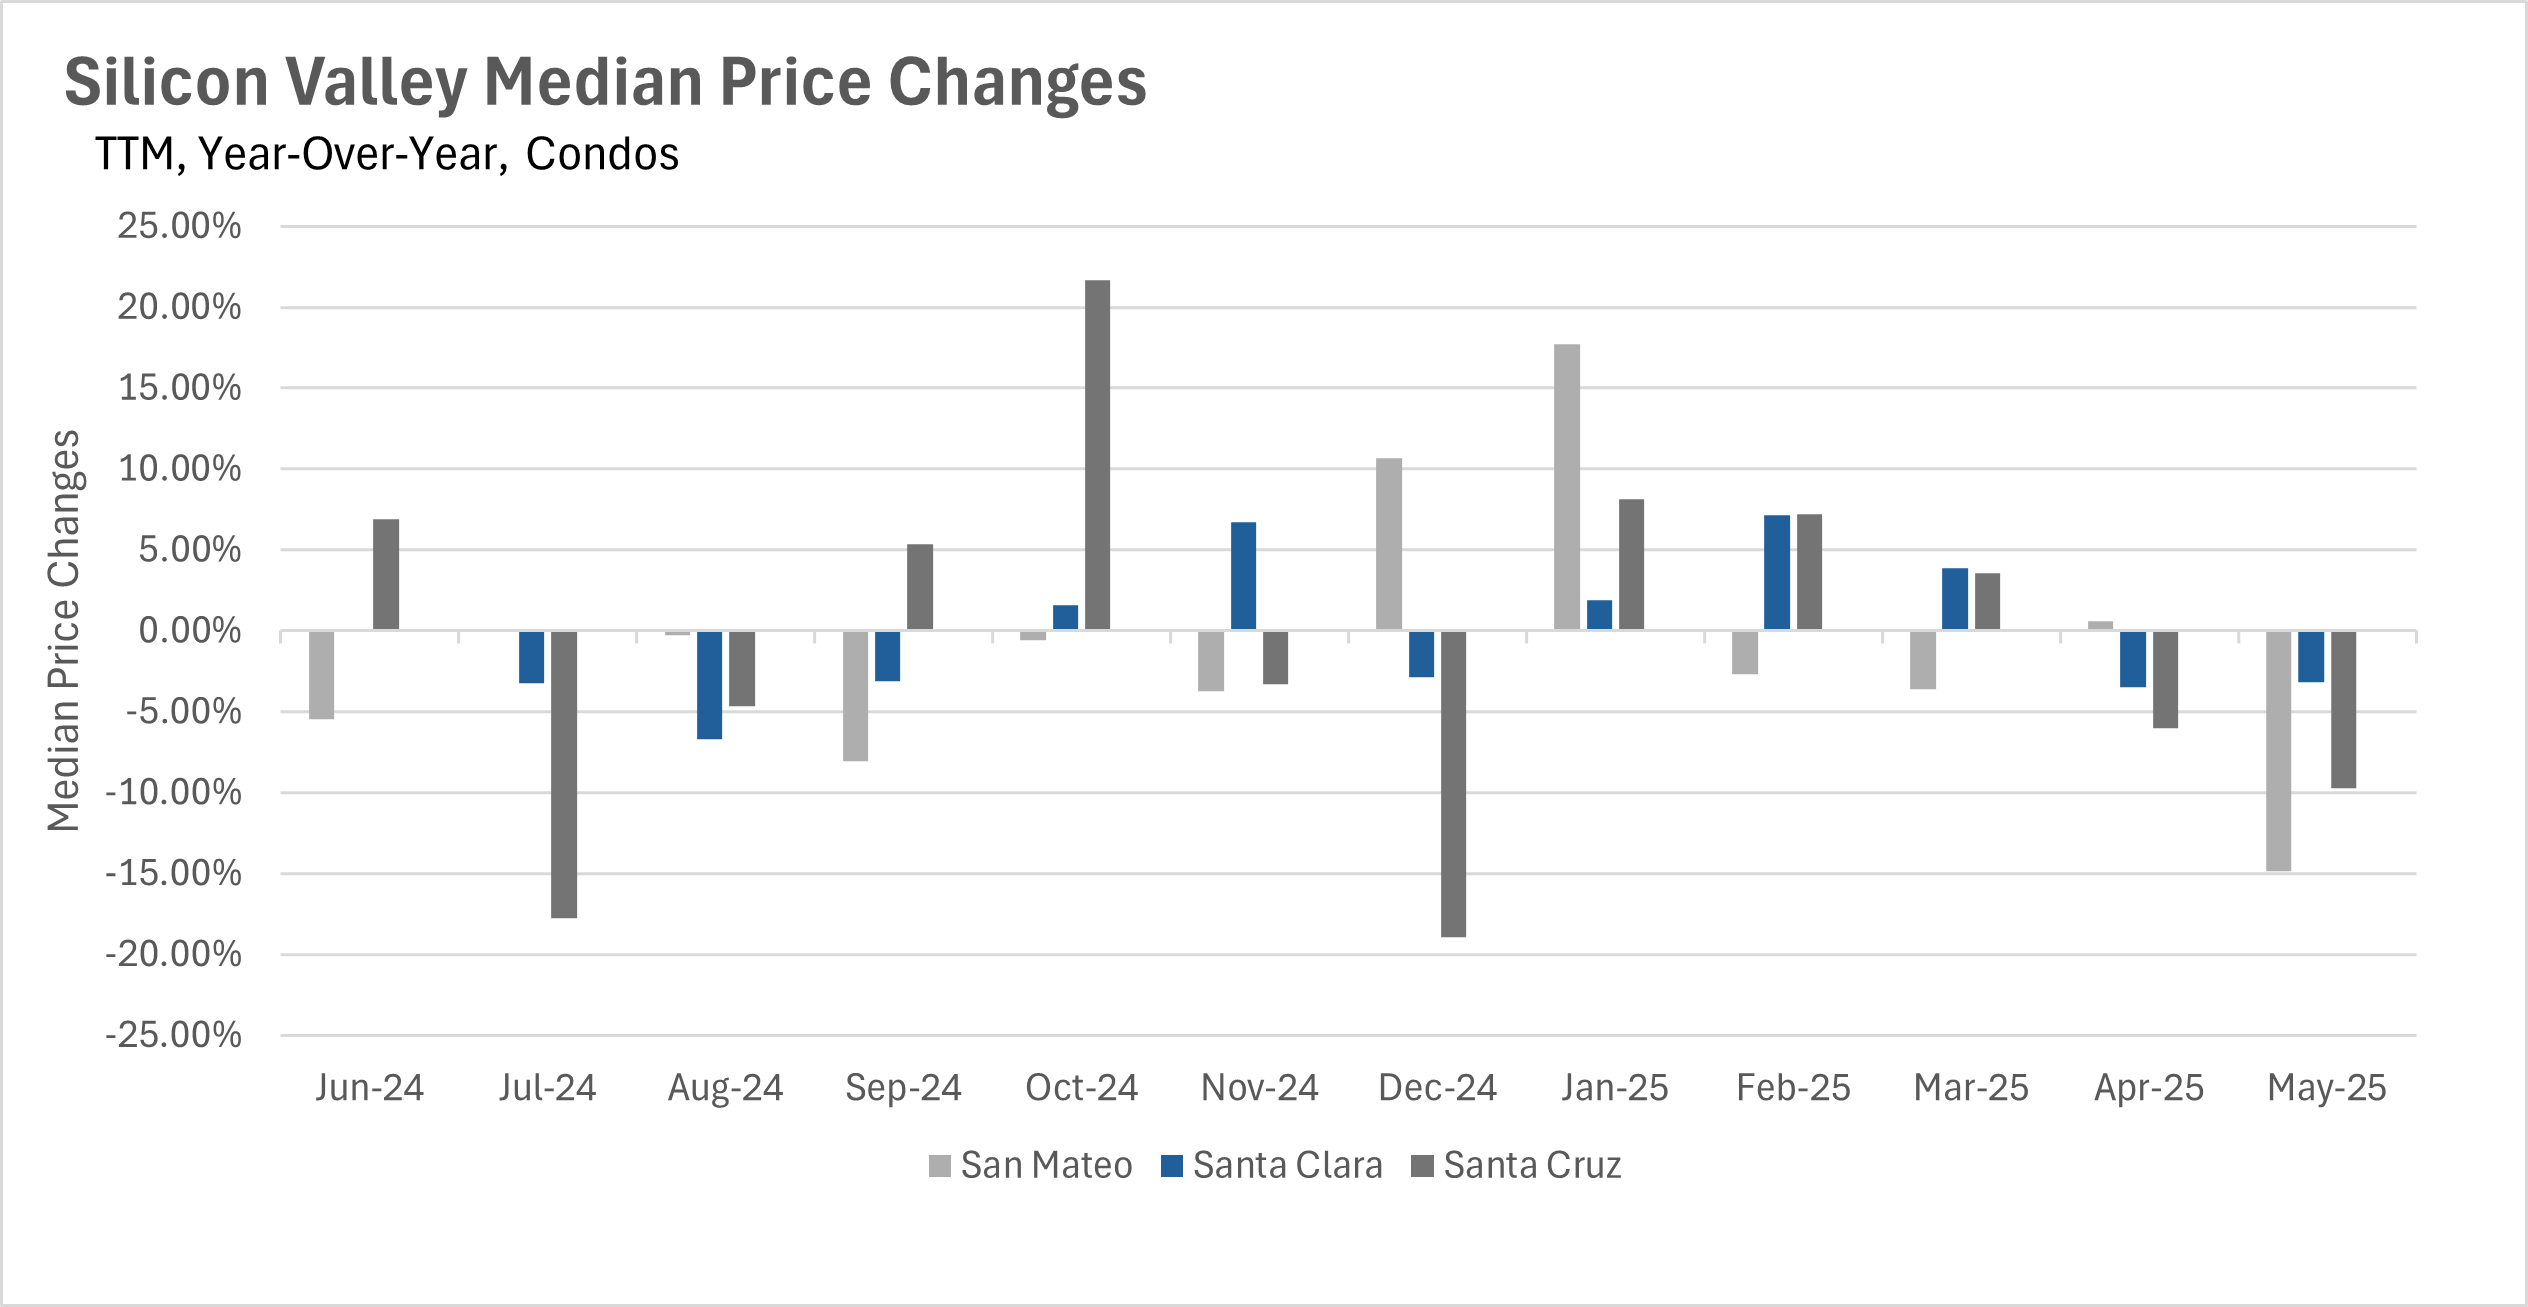
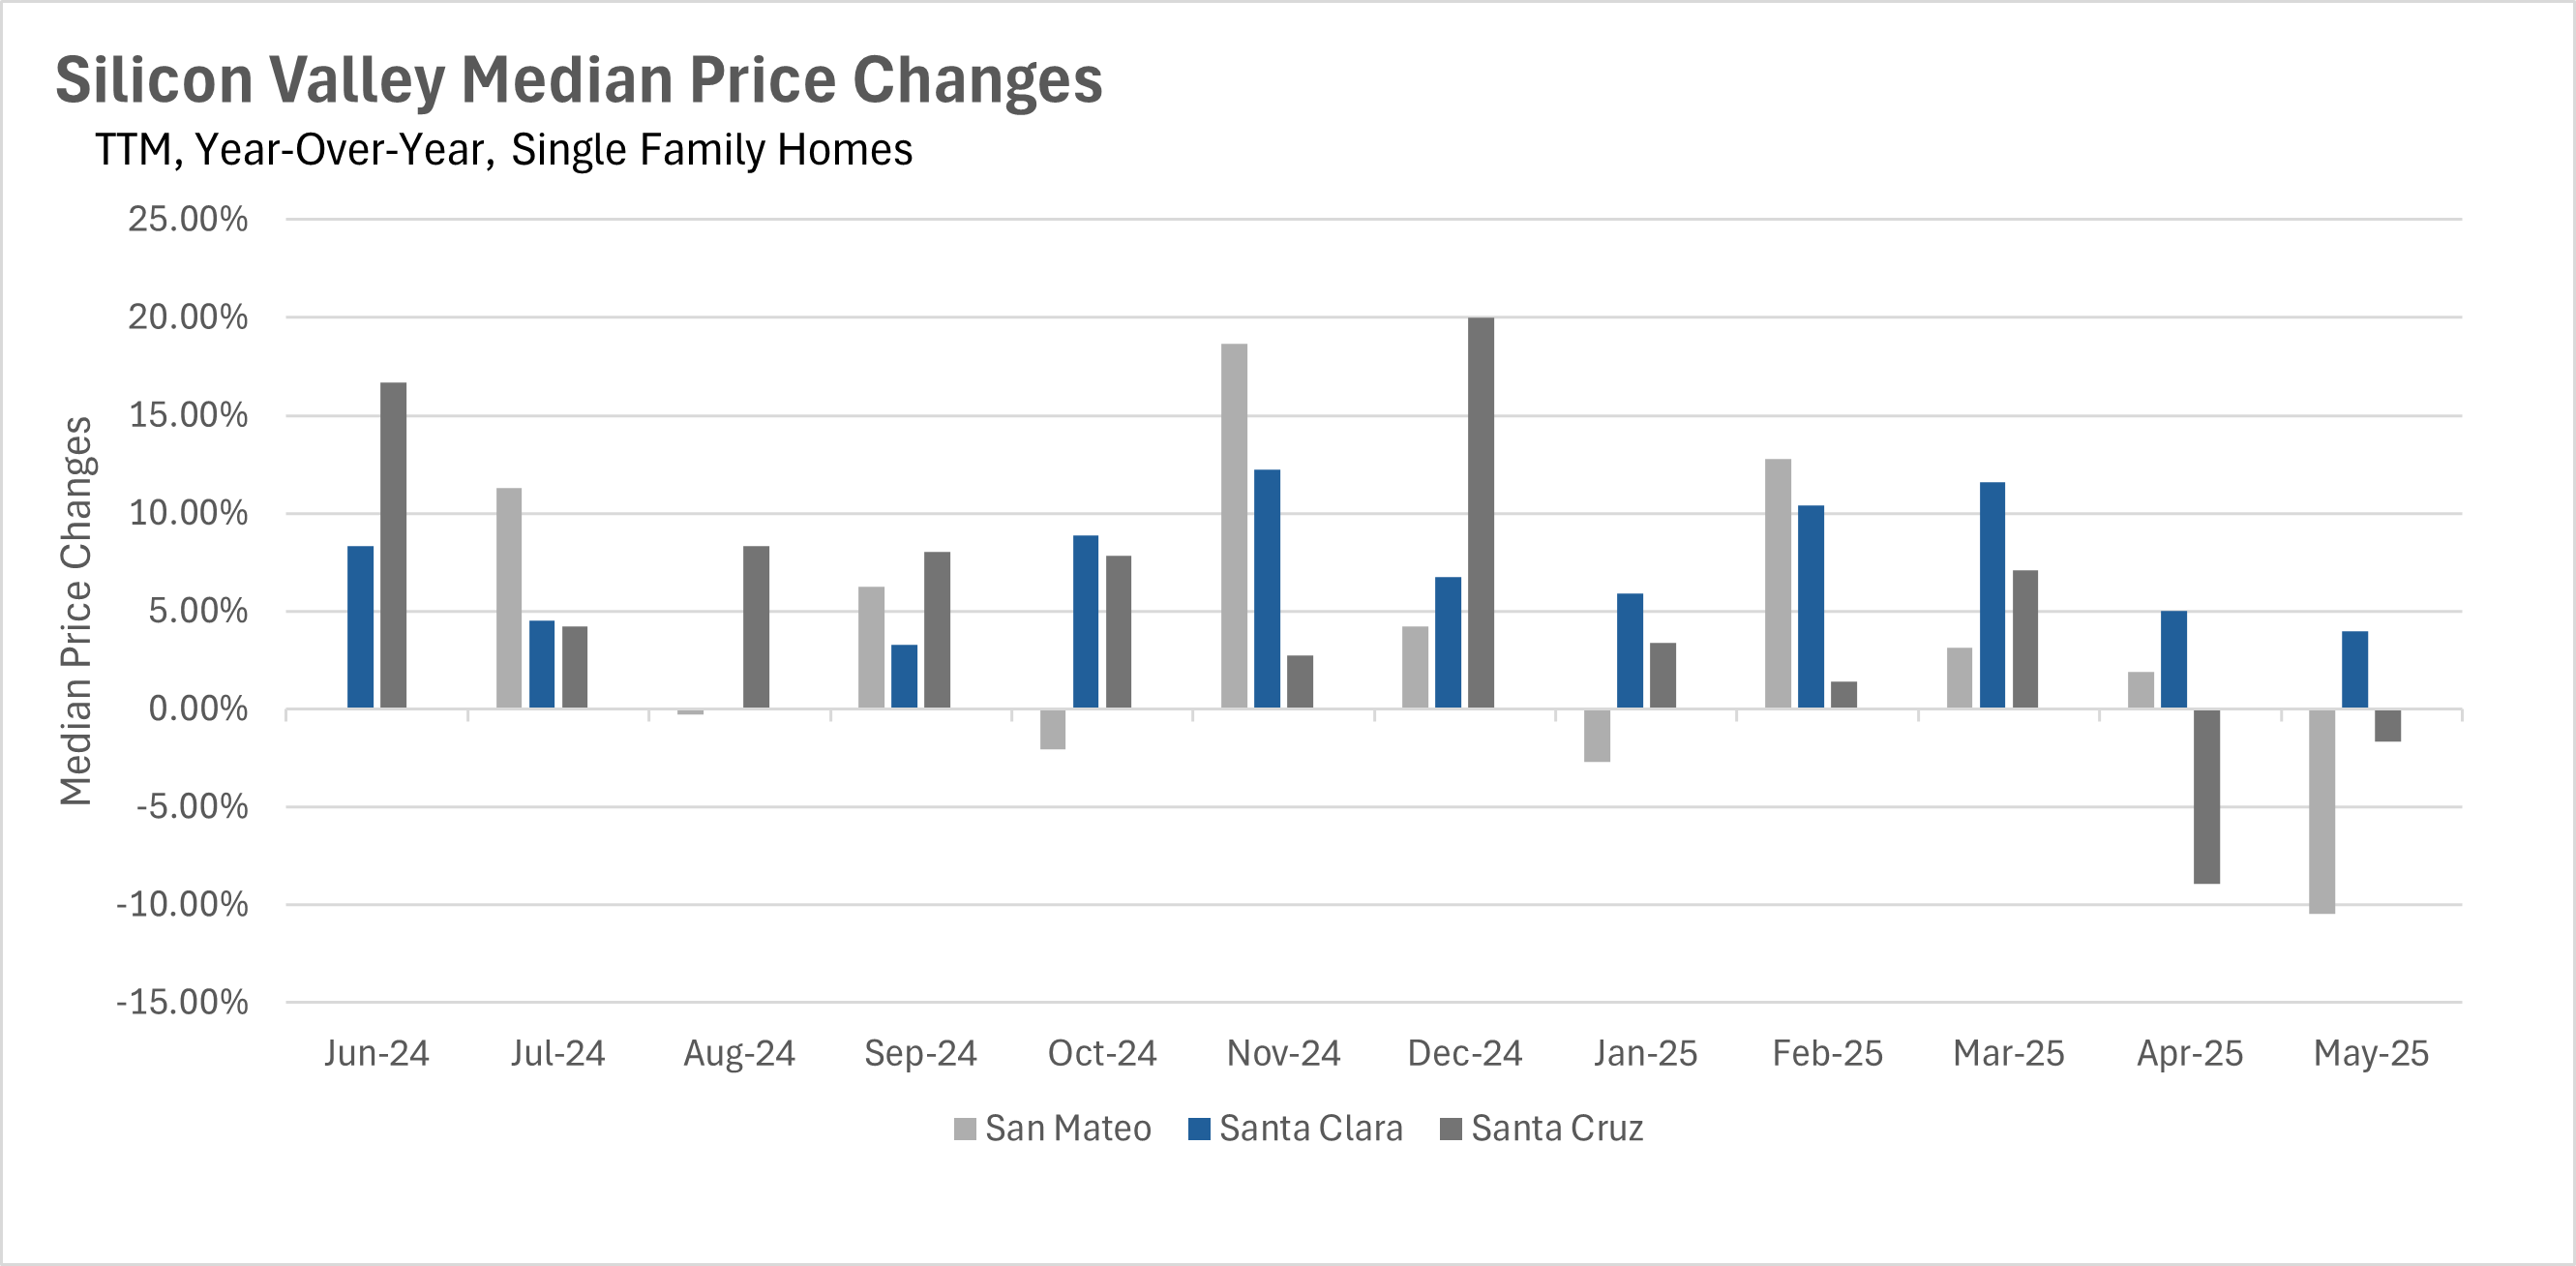
We’ve mentioned it quite a few times over the past few months, but for nearly two years, median sale prices for single-family homes in Silicon Valley seemed to only increase. However, this month, we saw some softness in the market, as median sale prices decreased by 1.65% on a year-over-year basis in Santa Cruz County, and 10.46% in San Mateo County. However, it’s worth noting that homes have not given back any of their value in Santa Clara County, which saw median sale prices increase by 3.99% on a year-over-year basis. In the condo market, we saw even more drastic declines, as median sale prices decreased on a year-over-year basis by 14.88% in San Mateo County, 3.19% in Santa Clara County, and 9.71% in Santa Cruz County.
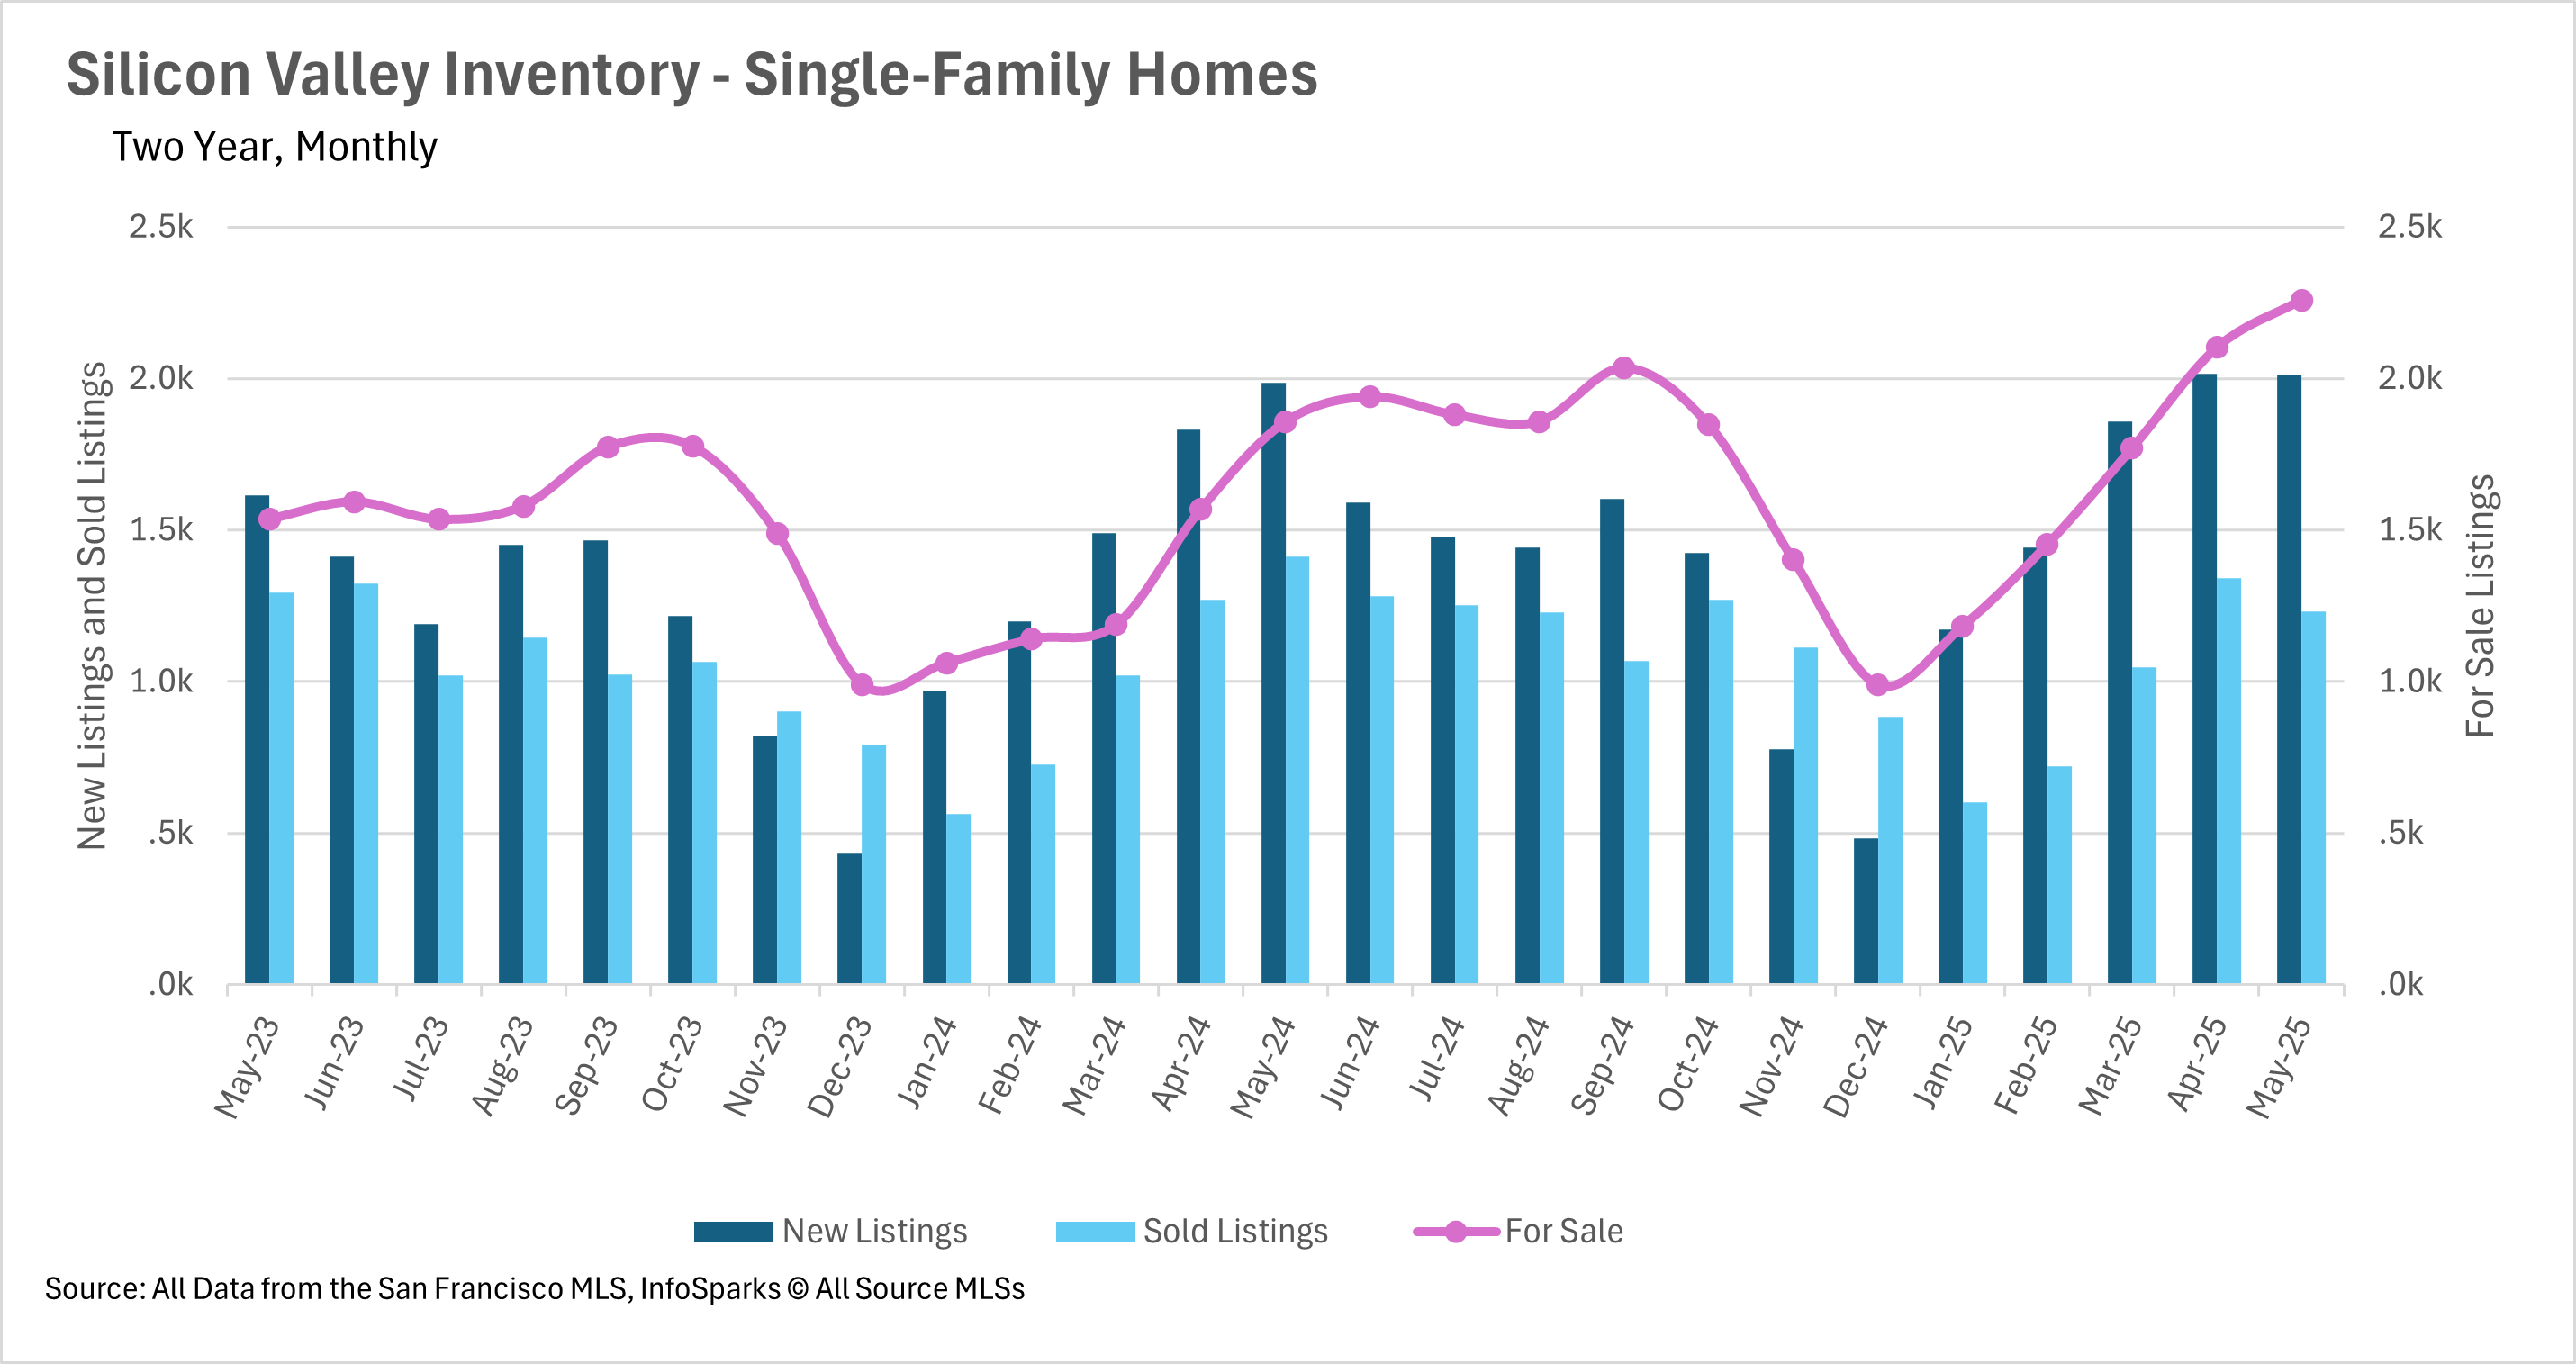
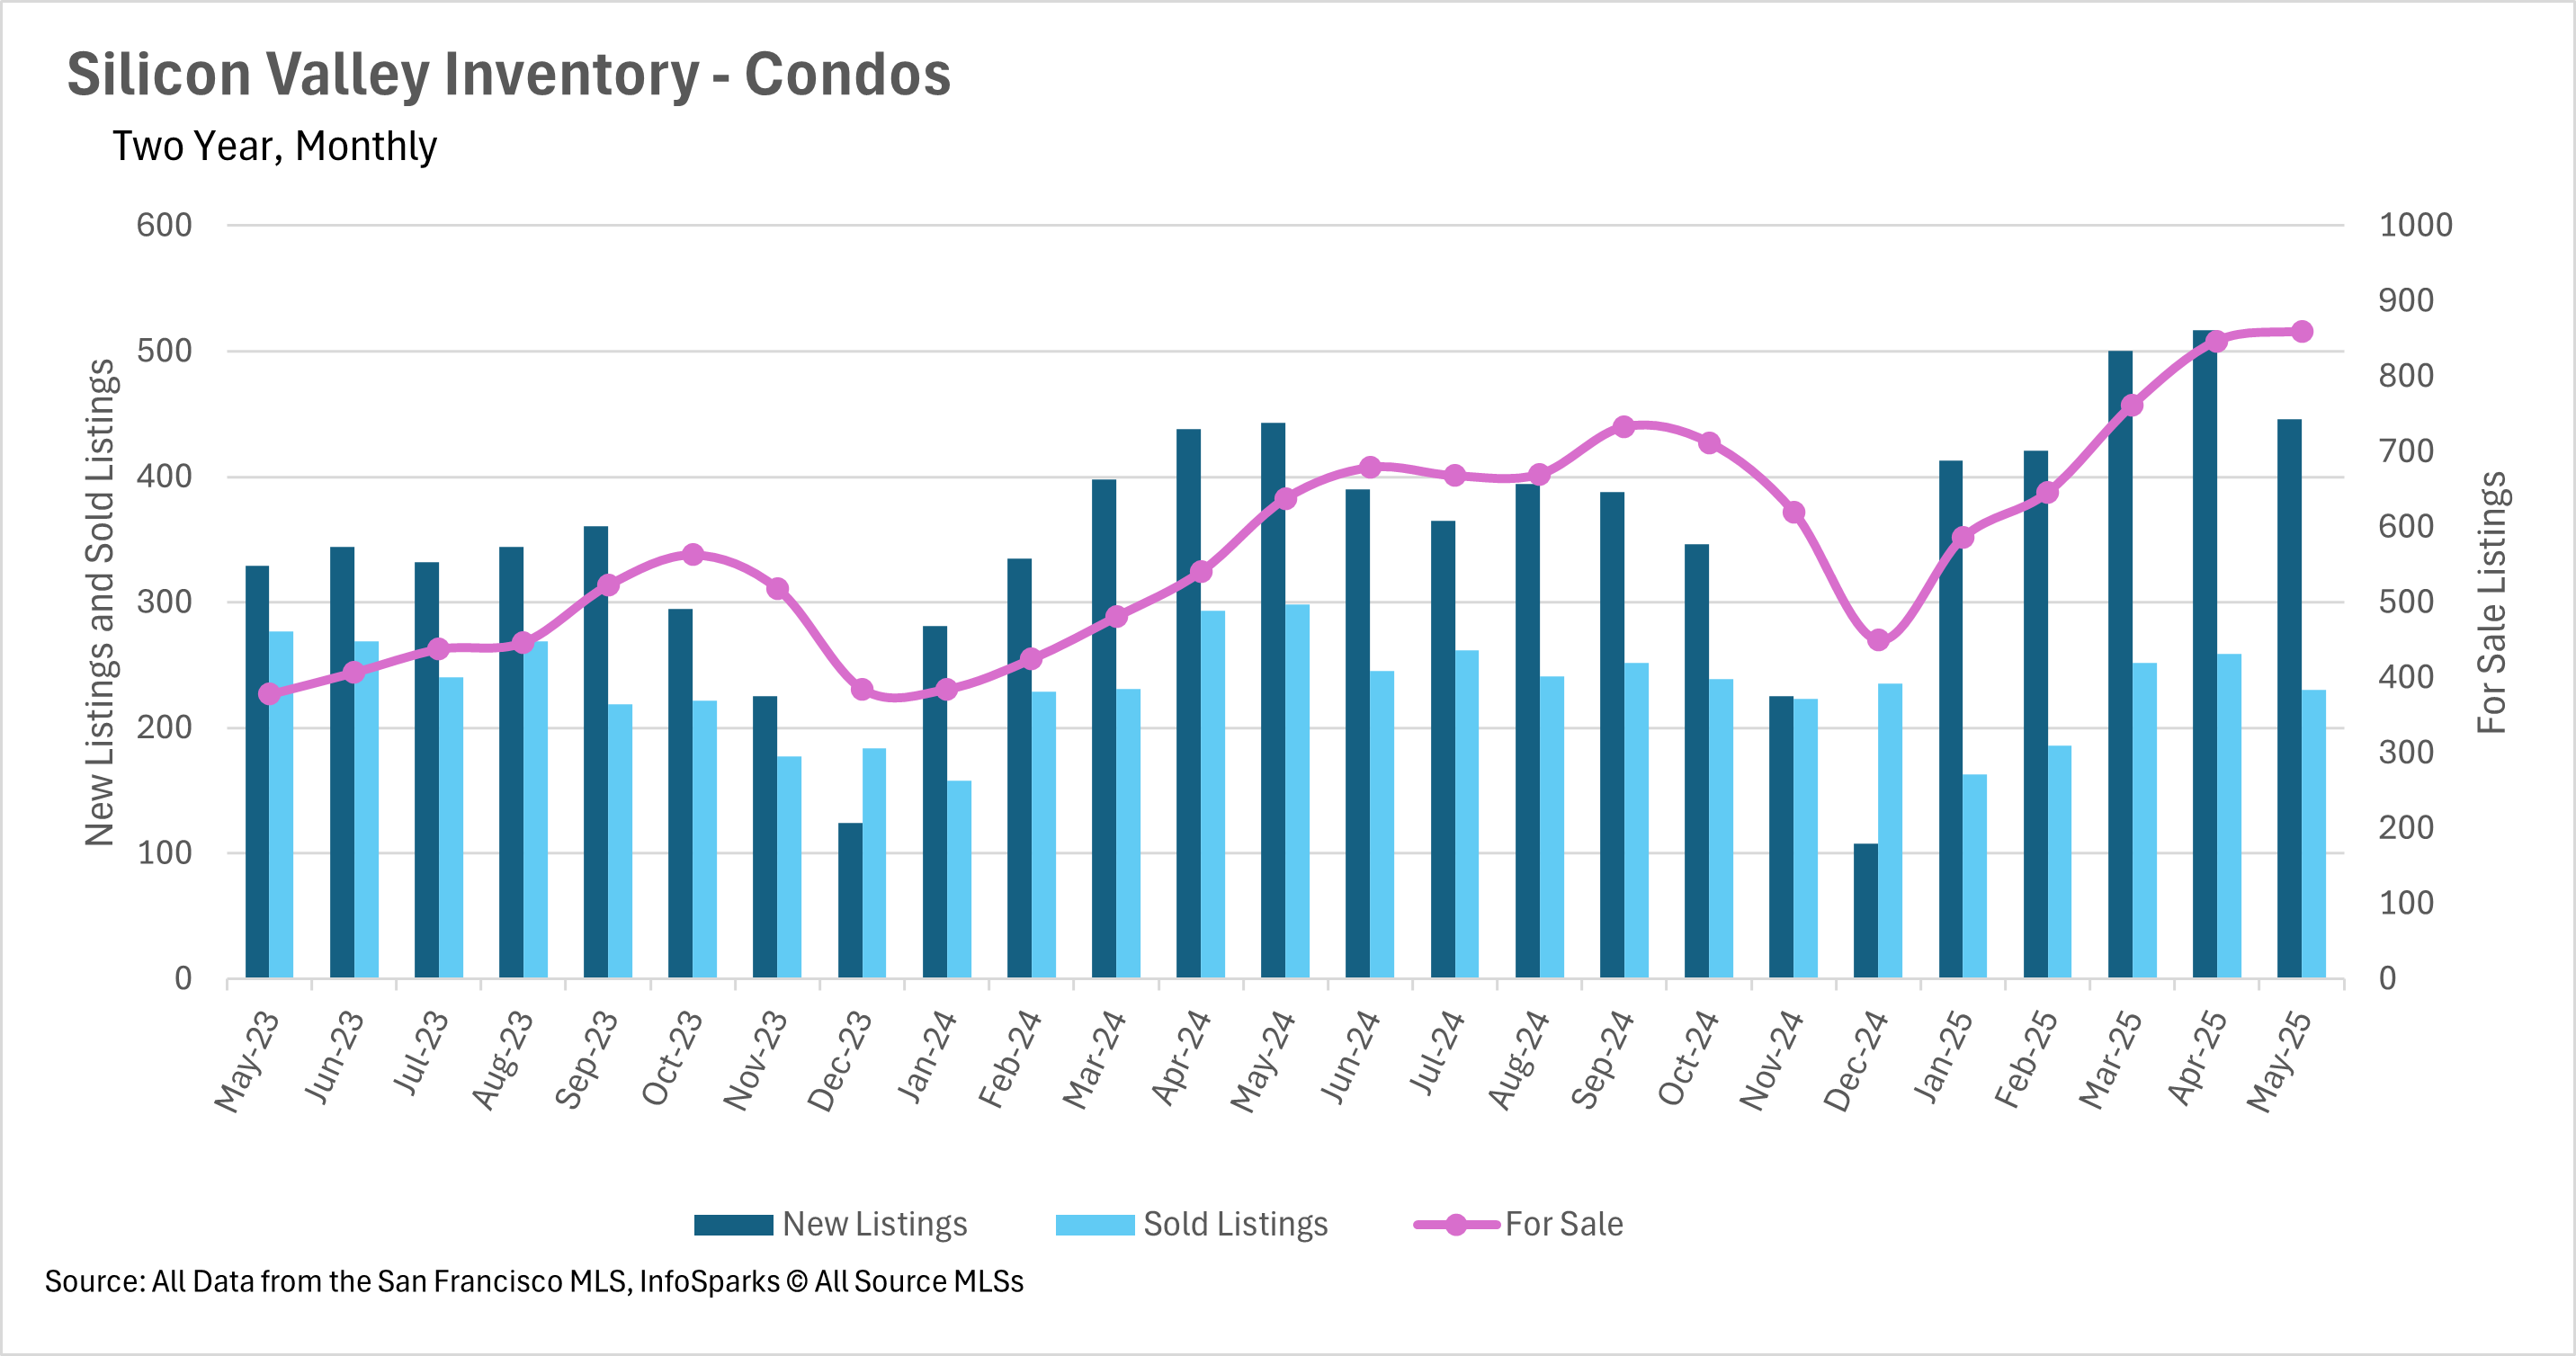
In the month of May, we saw both the single-family and condo markets set new two-year records in terms of the number of active listings on the market. Single-family home inventories jumped by 21.65% on a year-over-year basis, and condo inventories jumped by 34.80%. Although slightly more new listings were added when compared to last year, there were drastically fewer sold listings. In fact, the condo market saw 22.82% fewer listings sell than this time last year, while the single-family market saw 13.01% fewer listings sell. This very well may be due to the uncertainty surrounding the trade war in April, due to the fact that it takes a few weeks for a listing to formally “sell”.
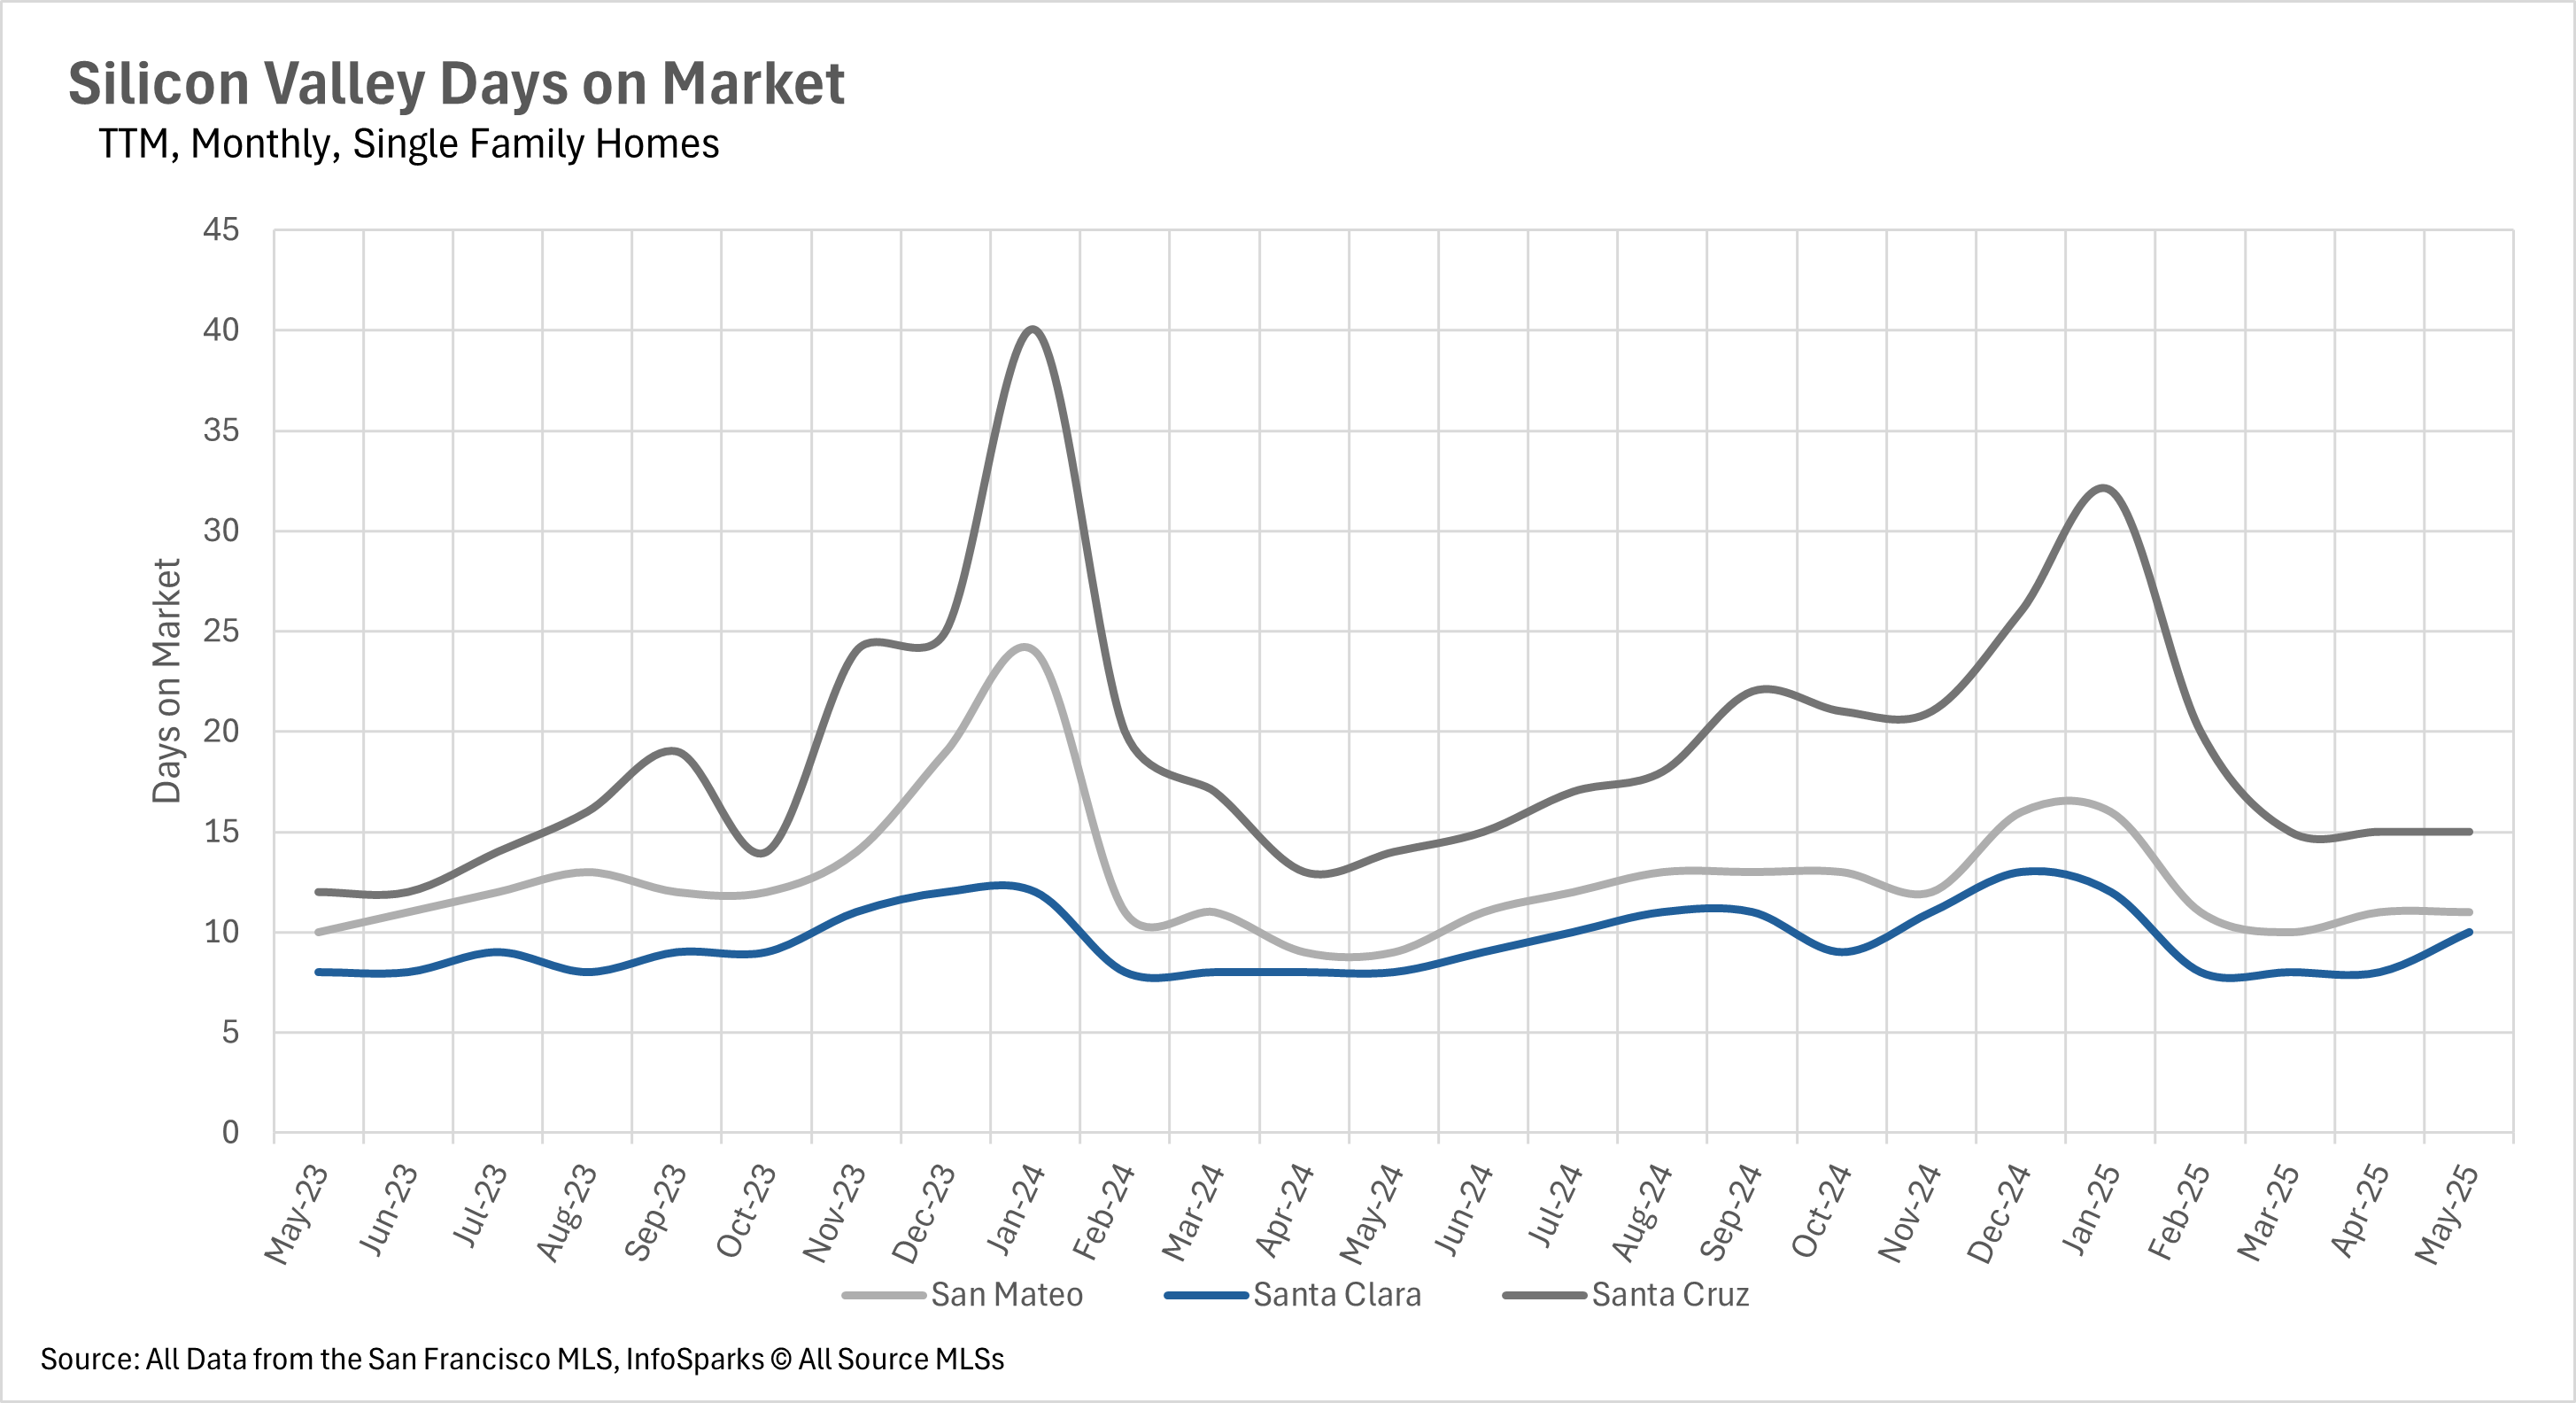
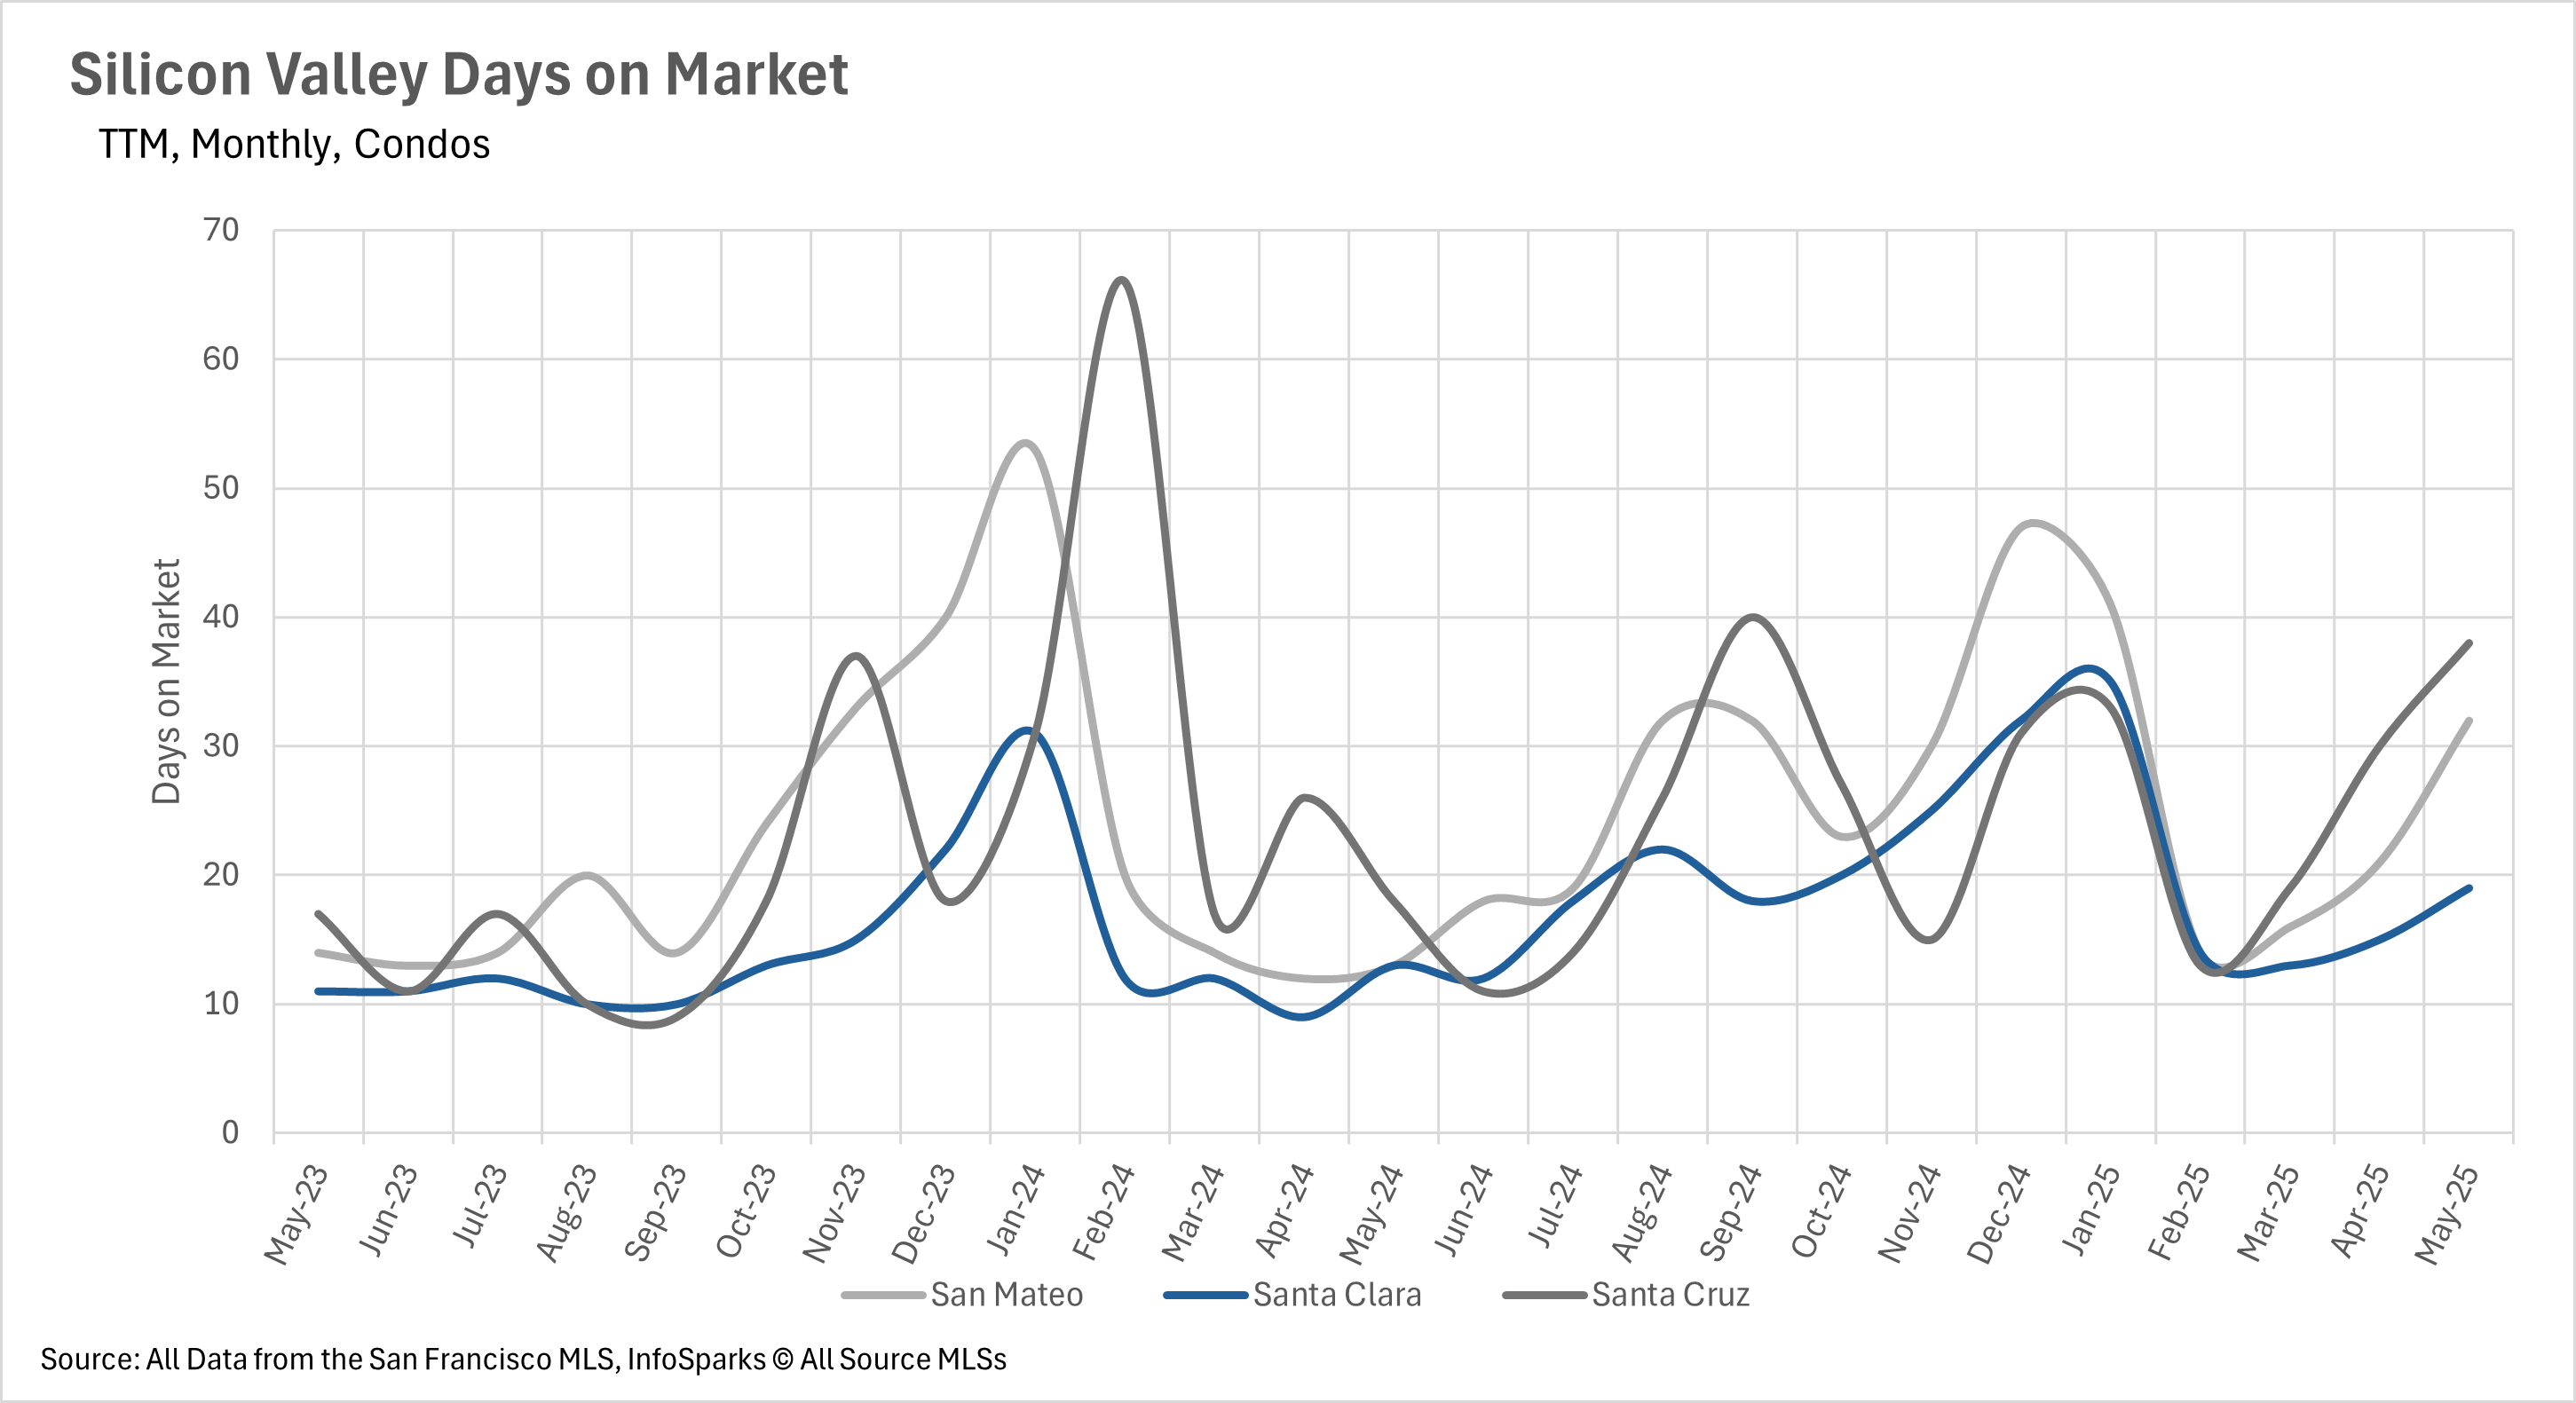
Although single-family homes are within their long-term average in terms of the amount of time they are spending on the market, the average condo is spending a tremendous amount of time on the market, with condos spending 46.15%, 111.11%, and 146.15% more days on the market on a year-over-year basis in Santa Clara, Santa Cruz, and San Mateo Counties, respectively. When you combine this with increased levels of inventory, buyers might be able to find some incredibly motivated sellers, and purchase a great property for an even better price!
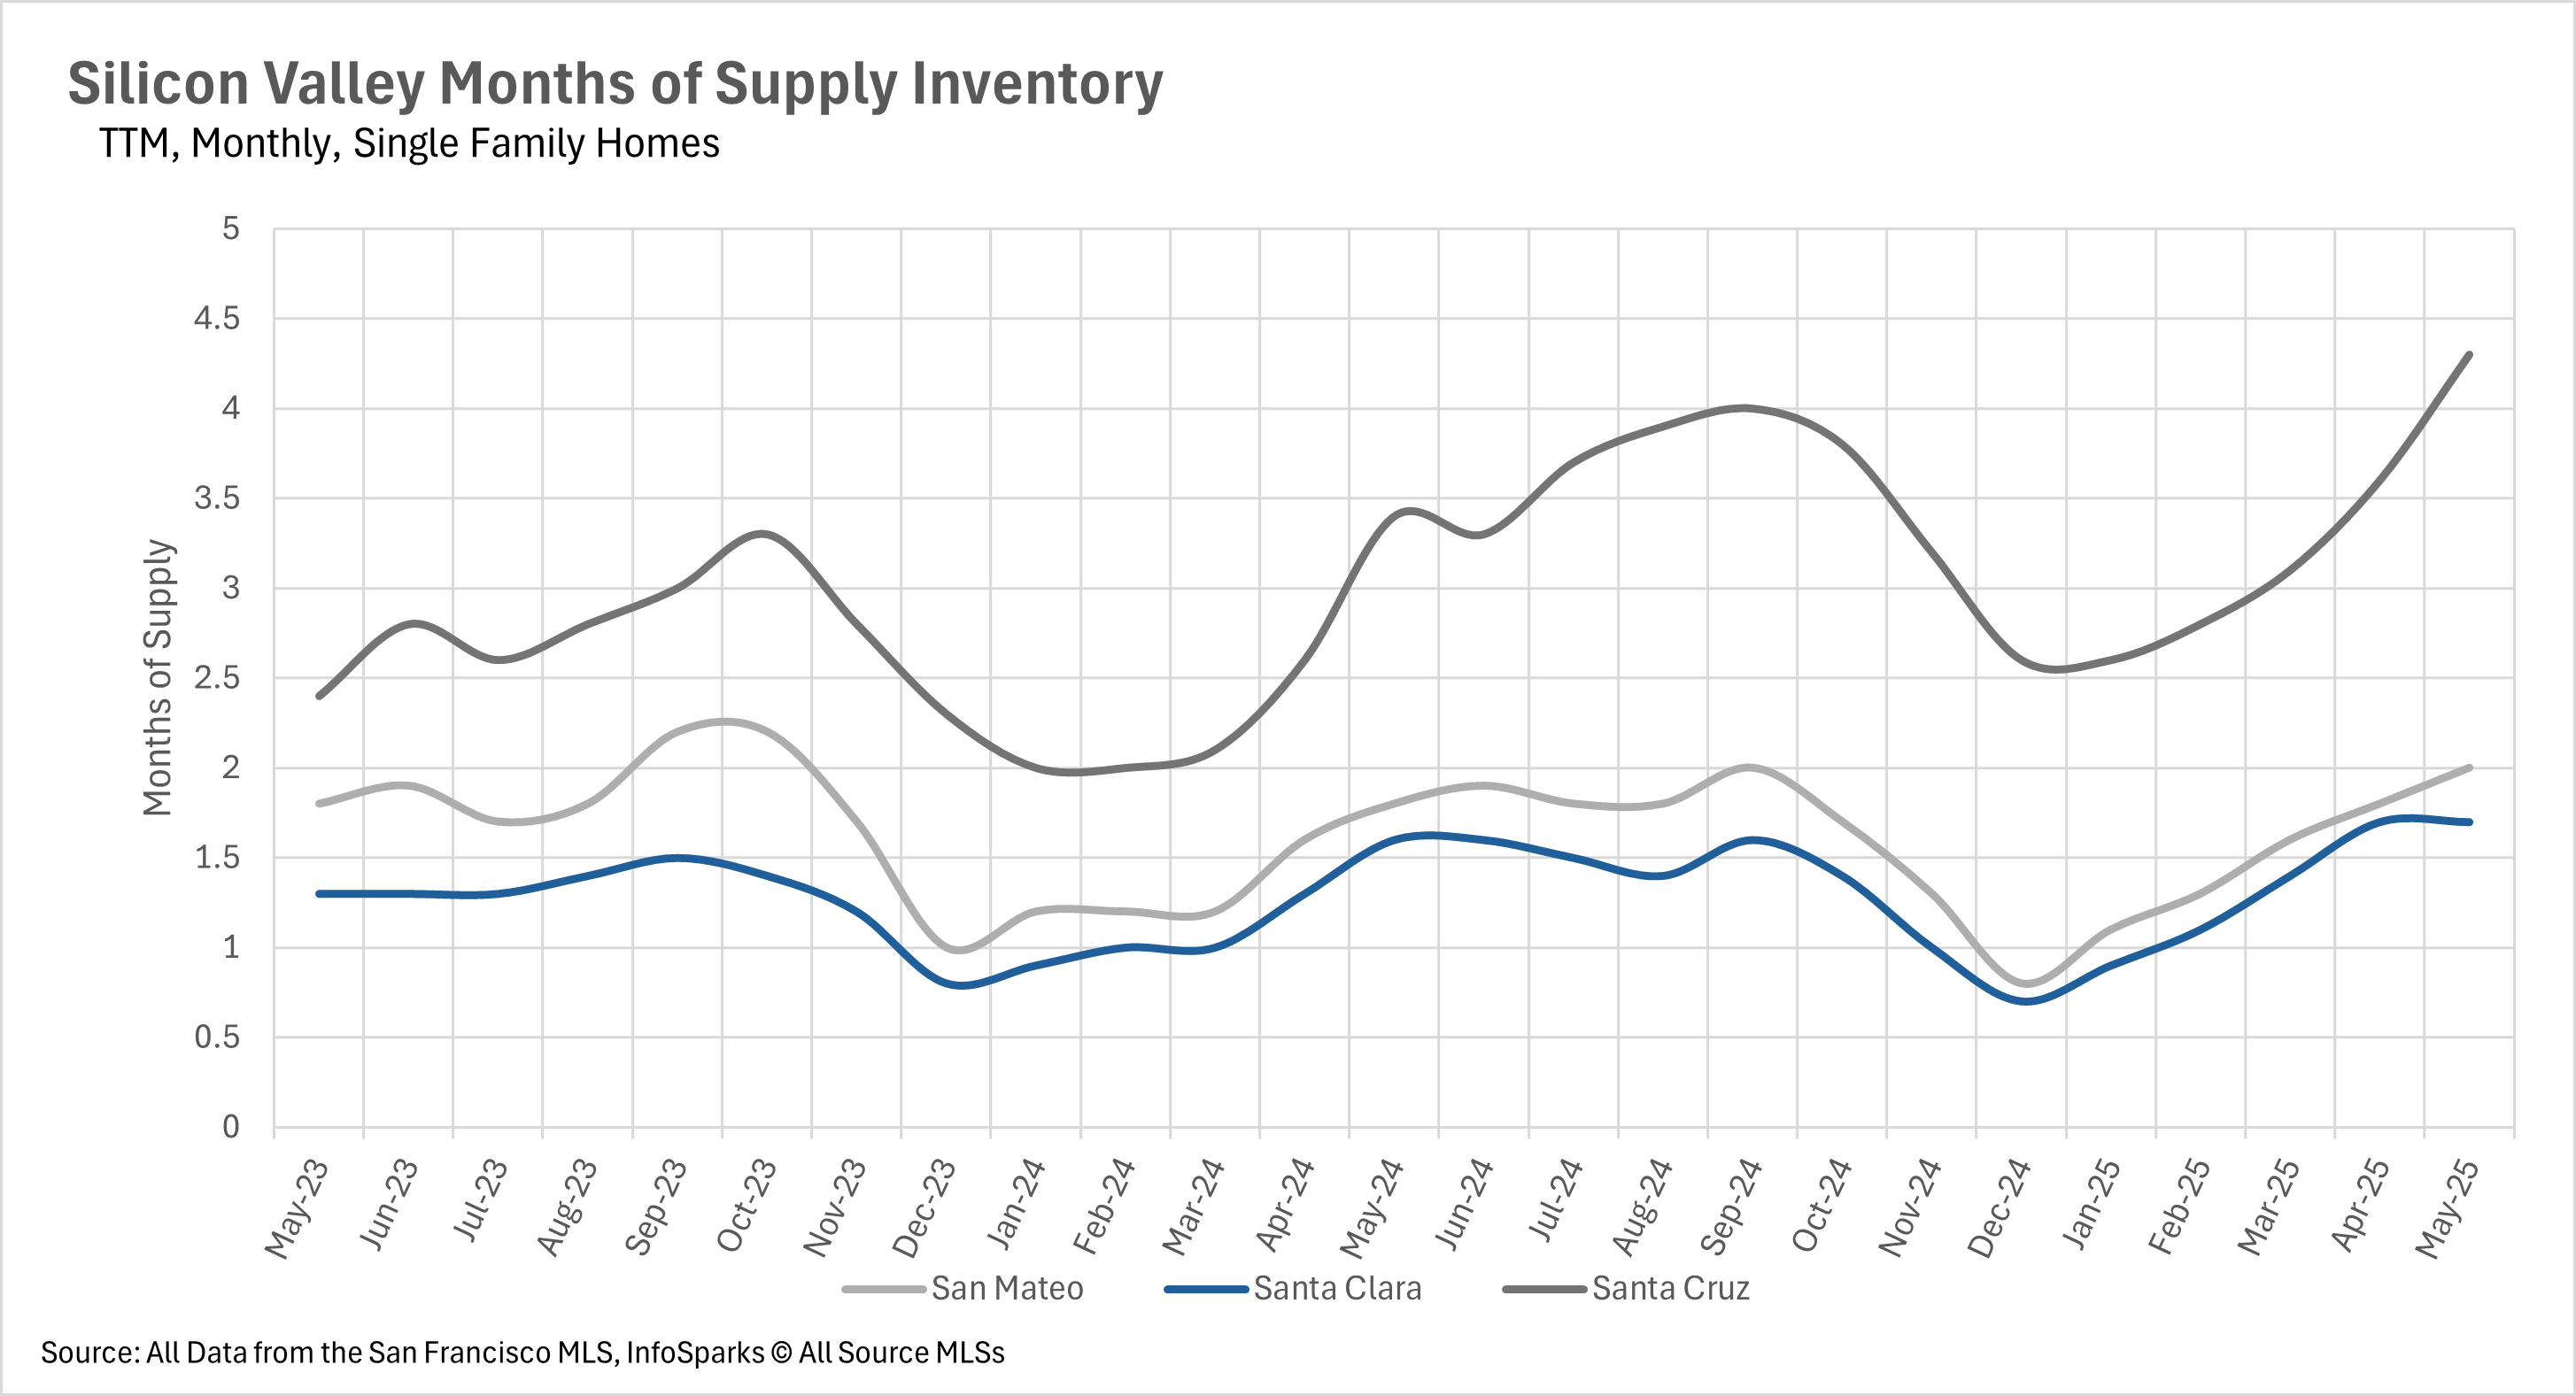
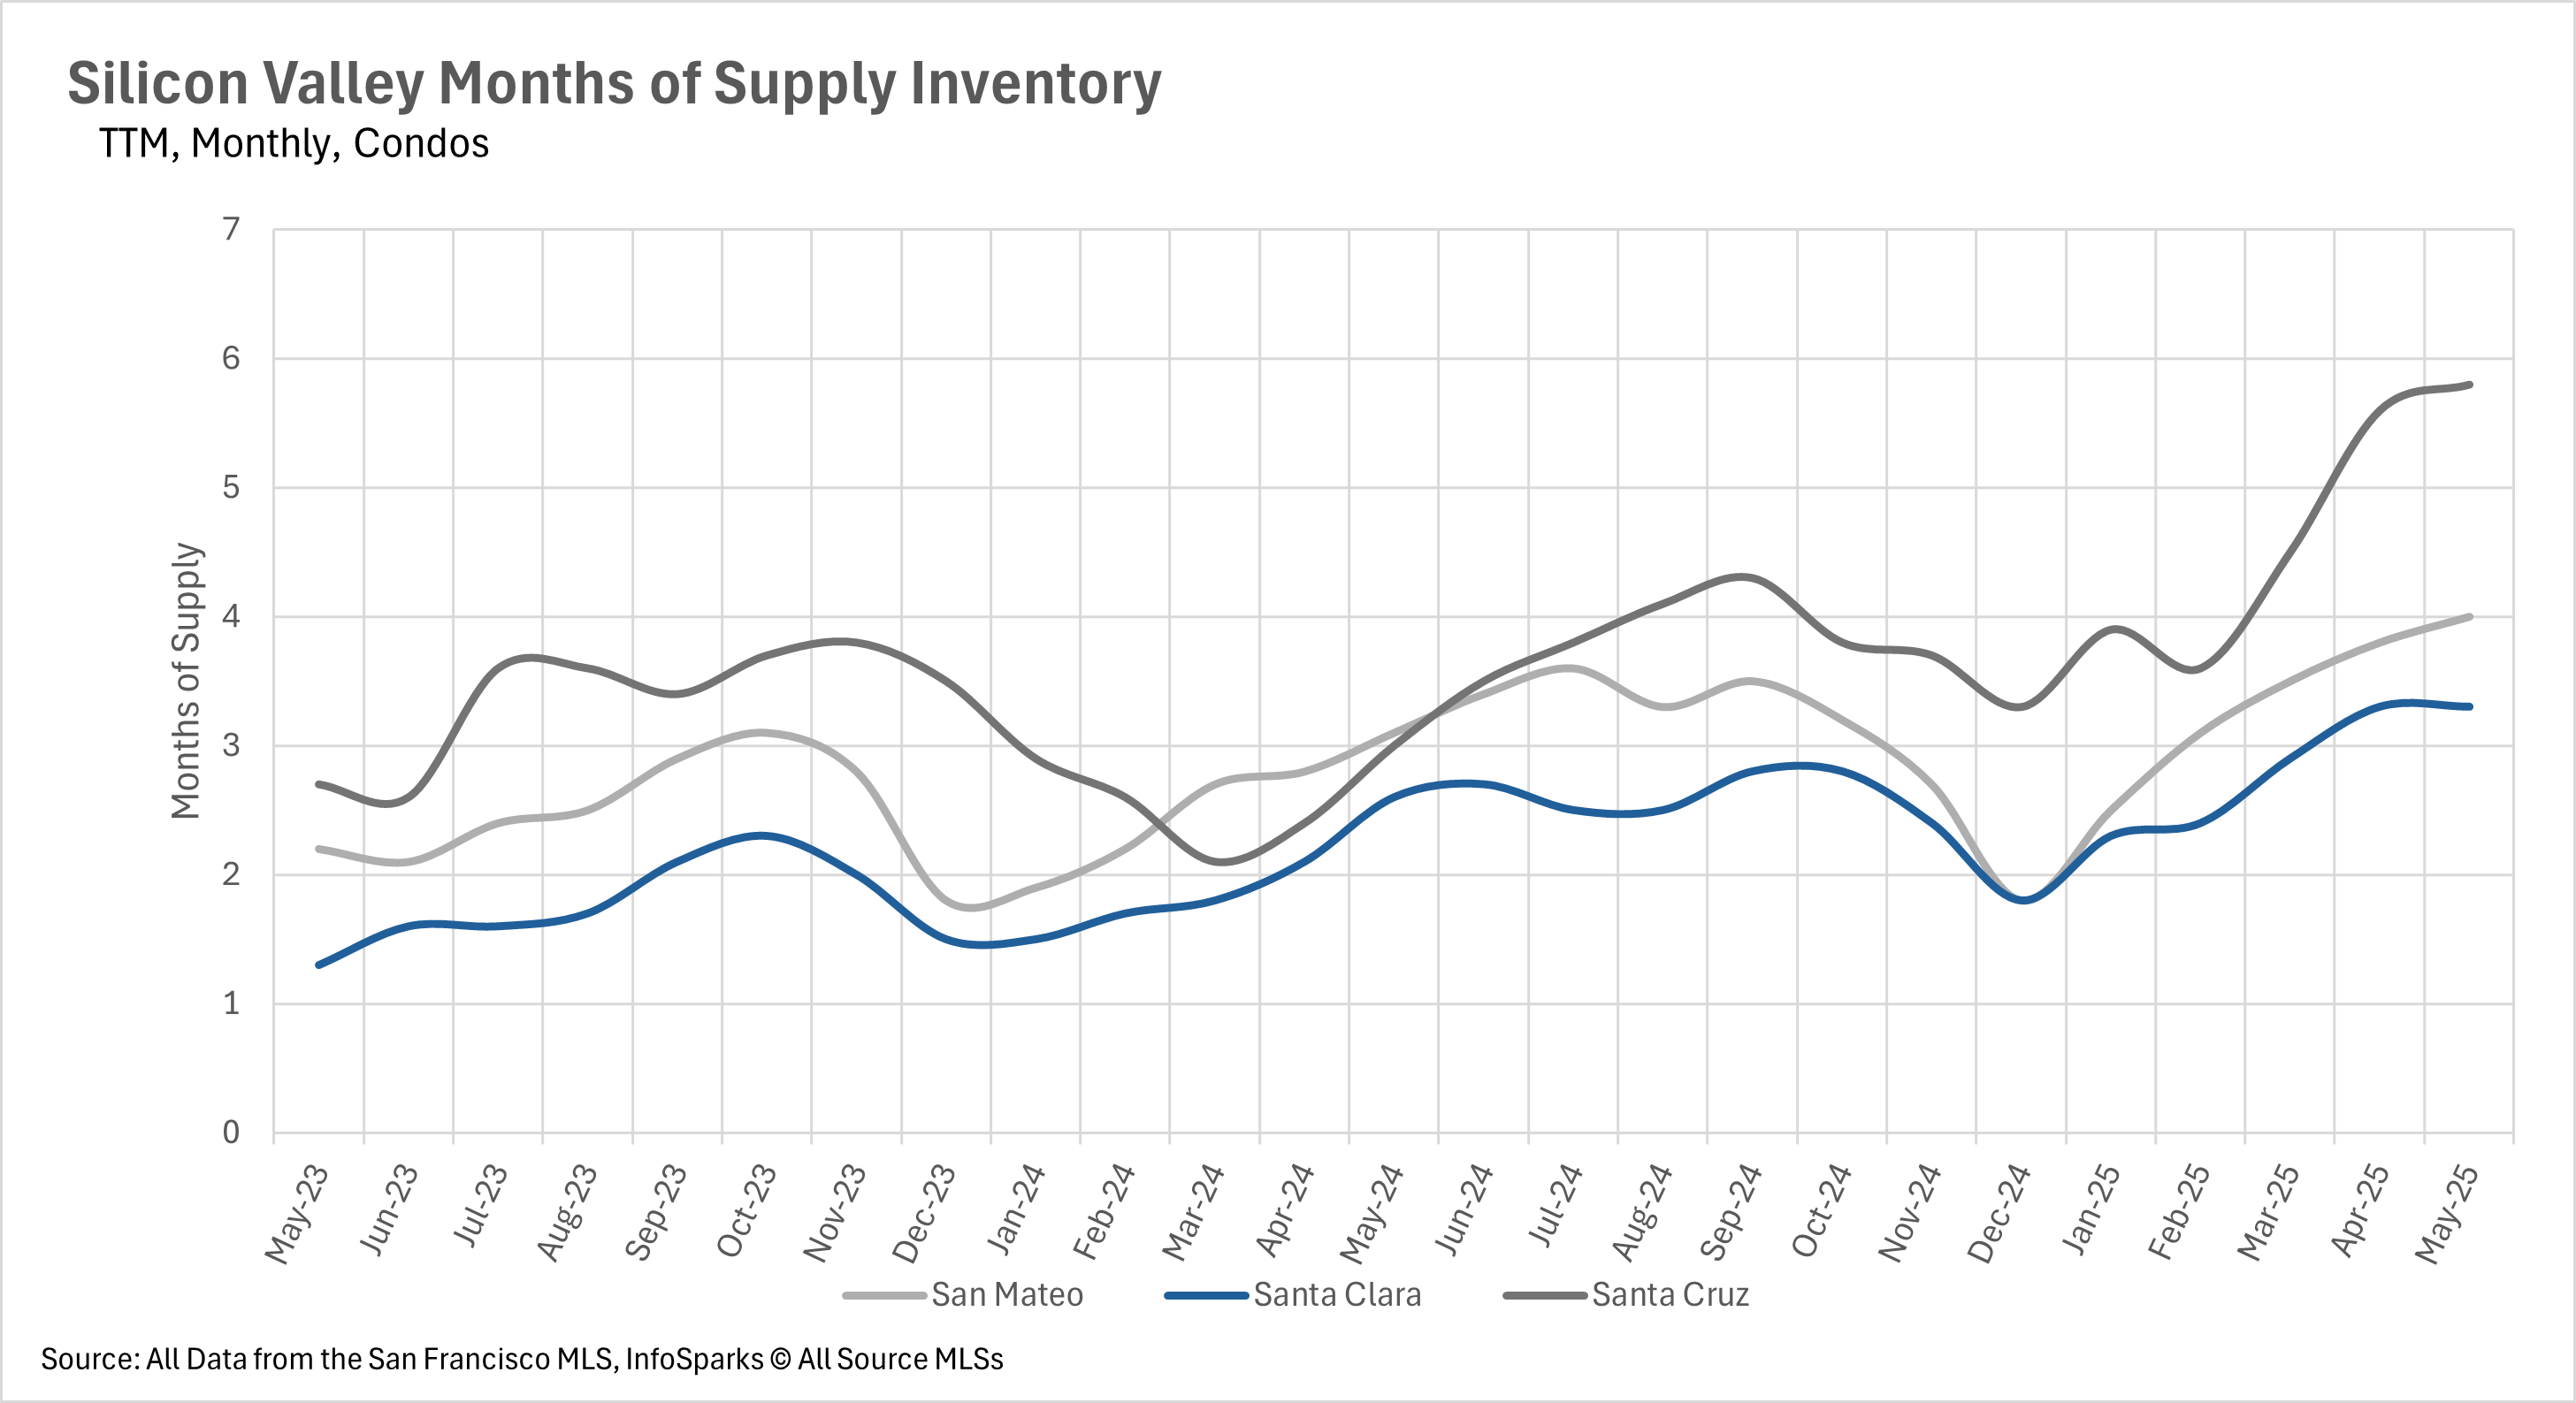
When determining whether a market is a buyers’ market or a sellers’ market, we look to the Months of Supply Inventory (MSI) metric. The state of California has historically averaged around three months of MSI, so any area with at or around three months of MSI is considered a balanced market. Any market that has lower than three months of MSI is considered a sellers’ market, whereas markets with more than three months of MSI are considered buyers’ markets.
Silicon Valley has largely become a buyers’ market at this point in time. When we look at the condo market, there are 4 months’ worth of supply on the market in San Mateo County, 3.3 months in Santa Clara County, and 5.8 months in Santa Cruz County, making them all buyers’ markets. However, turning to the single-family home market, only Santa Cruz County is a sellers’ market, with 4.3 months worth of supply available. San Mateo and Santa Clara Counties are both sellers’ markets, with 2 and 1.7 months’ worth of supply on the market, respectively.
Stay up to date on the latest real estate trends.

Market Update

Real Estate 101 | Palo Alto

Real Estate 101 | Atherton

Real Estate 101 | Menlo Park

Real Estate 101 | Menlo Park

Market Update
We know that real estate transactions can be complex, but with our expertise, they don’t have to be stressful. Our team is dedicated to handling every aspect of your Mid-Peninsula real estate needs with the utmost care and professionalism. From the initial consultation to the closing, we manage all the details so you can focus on your future. Whatever challenges arise, trust that we’ve got this — your success is our top priority.