San Mateo Home Prices Jump 10% as Silicon Valley Housing Supply Hits New Lows
Market Update David Weil August 19, 2026
Market Update David Weil August 19, 2026
Quick Take:
Median home sale prices pulled back from June's twelve-month high, but at $434,100 they remain nearly 2% above where they stood a year ago.
Inventory declined in July, slipping below year-ago levels for the first time in months, and new listings fell sharply from June.
Existing home sales eased from June's pace but held slightly above last July, keeping demand roughly flat year over year.
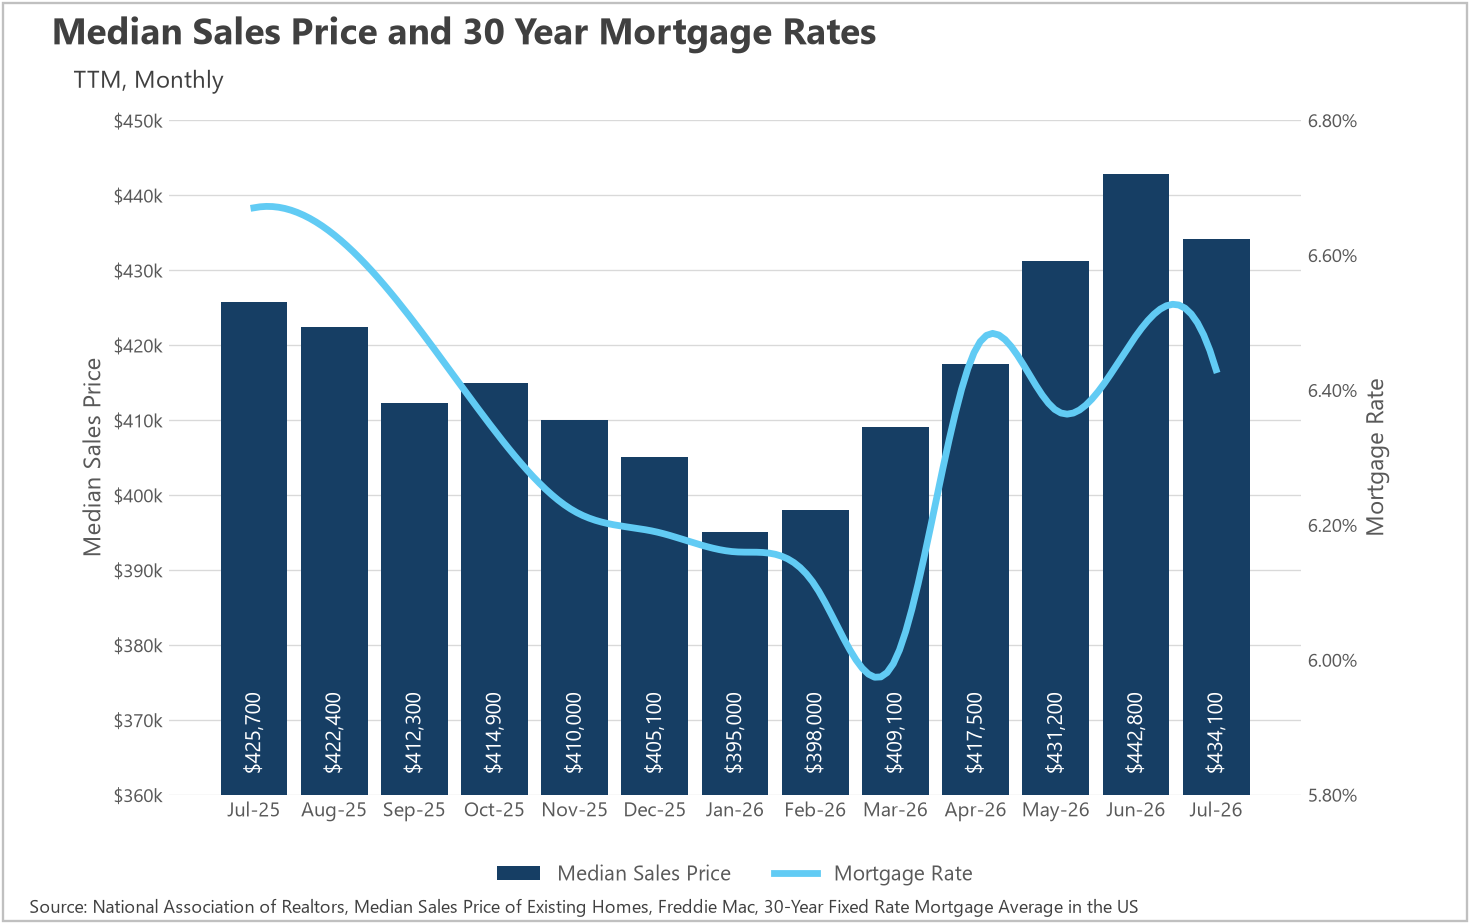
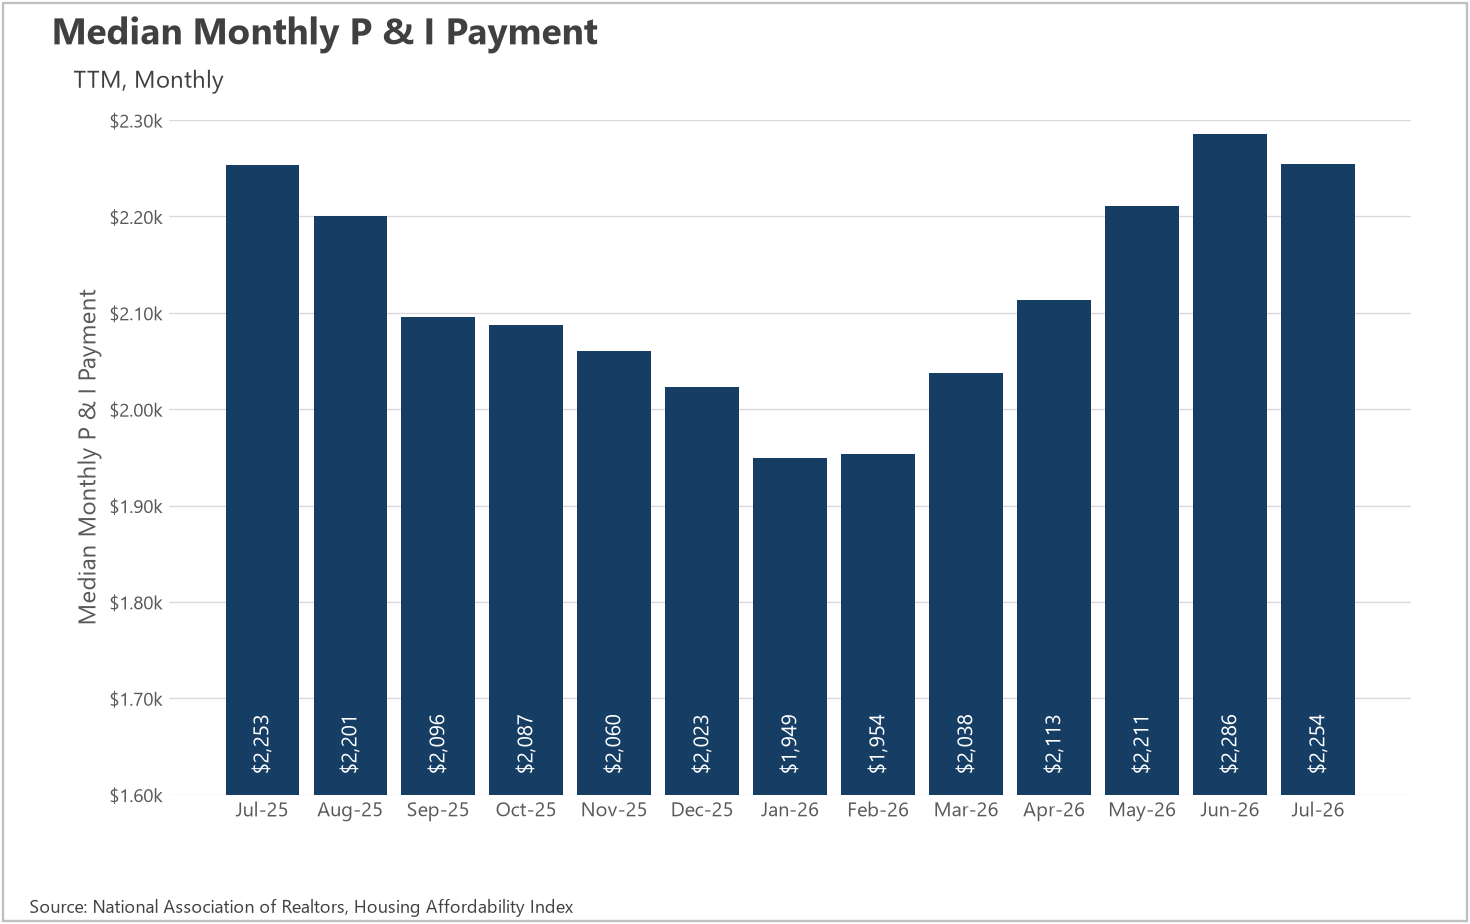
After five straight months of gains carried the median sale price to $442,800 in June, July brought the first pullback of the year. The median home sold for $434,100, a 1.96% decline from June, though still 1.97% higher than the $425,700 we saw in July of last year. A modest summer dip is not unusual, and the bigger picture is that prices have climbed roughly 9.9% since January's $395,000 trough. On the financing side, the 30-year mortgage rate eased slightly to 6.43% in July before jumping to 6.69% in August, its highest level since last summer and a meaningful move away from the 6% low we saw back in March. That combination of a slightly lower price and a slightly lower rate trimmed the median monthly P&I payment to $2,254 in July, down from $2,286 in June. The catch is that this figure is now essentially identical to the $2,253 buyers were paying a year ago, meaning the affordability advantage that lower rates delivered earlier in the year has been completely erased. With August rates moving higher, payments look likely to head back up.
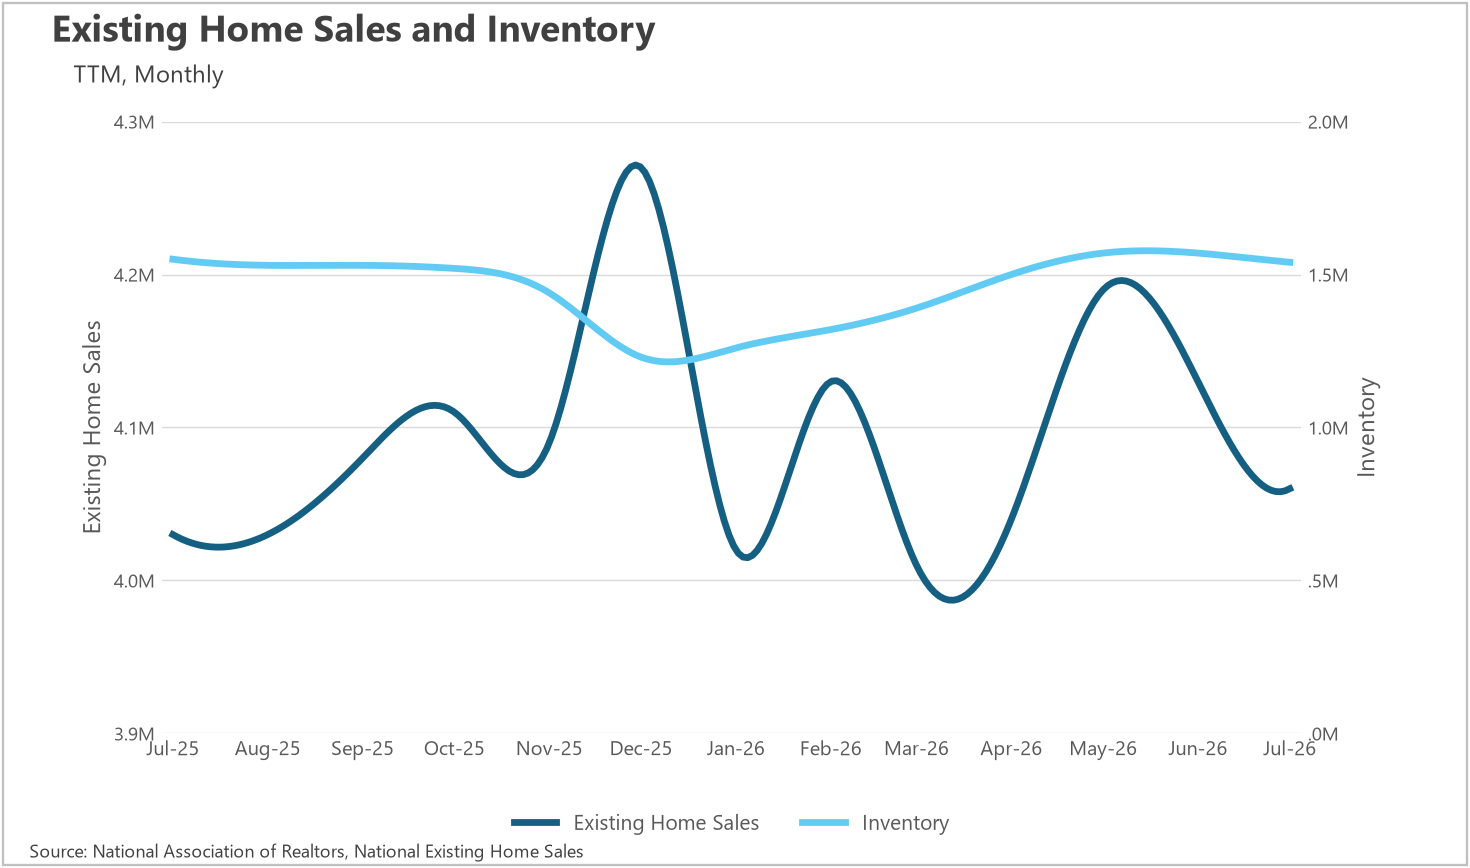
Inventory data runs one month ahead of the other figures, and it tells us the supply build that defined the first half of the year has reversed course. July inventory came in at 1,540,000 homes, a 1.91% decline from the 1,570,000 available in both May and June, and now 0.65% below the 1,550,000 we had at this time last year. That is a notable shift, because inventory had been running above year-ago levels through the spring. New listings reinforce the story.
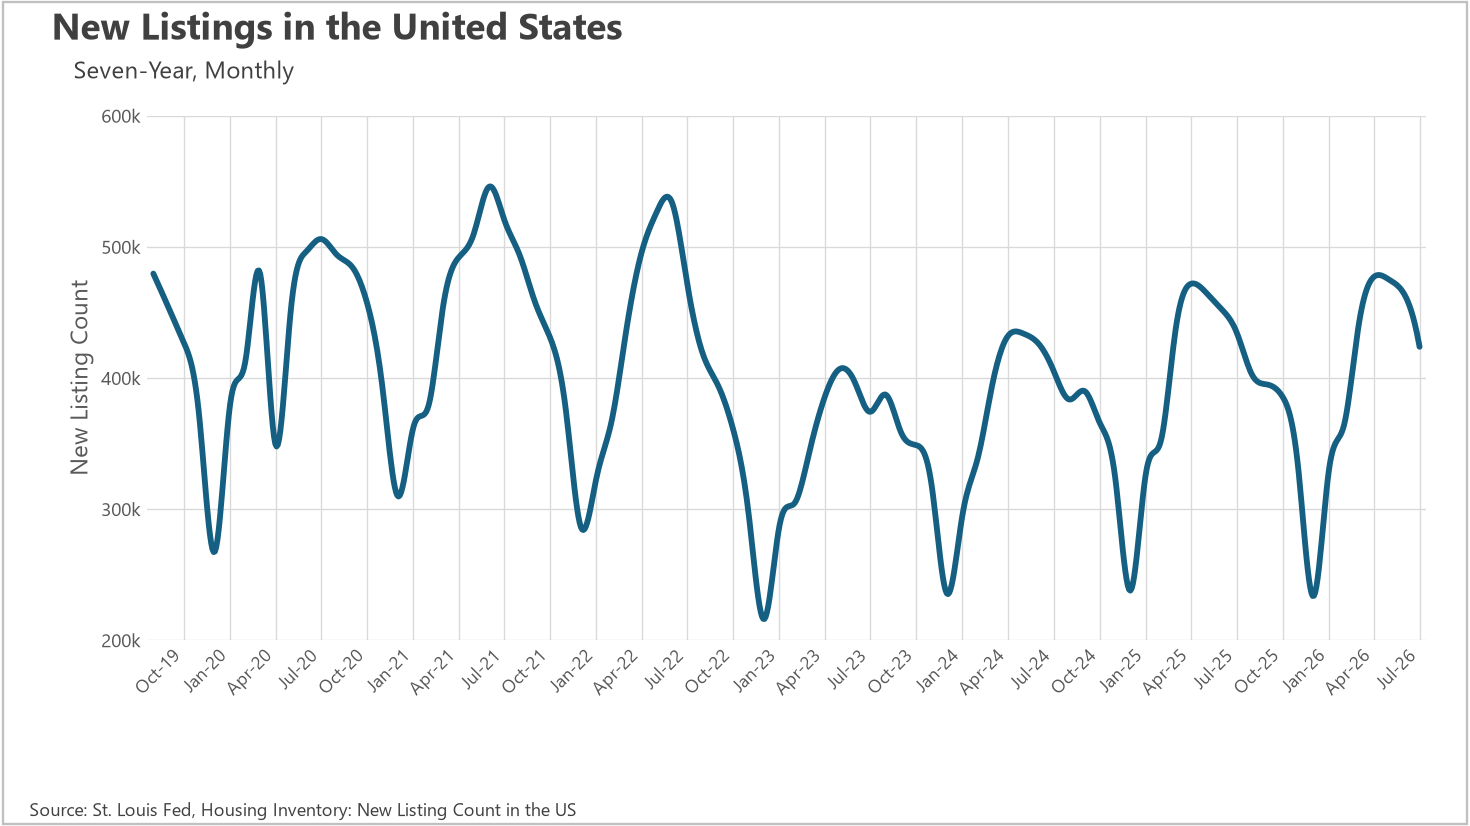
Sellers brought 423,732 new listings to market in July, an 8.58% drop from June and 2.55% below last July's 434,816. Seasonality explains part of that decline, since listing activity typically peaks in late spring, but the year-over-year decrease suggests homeowners are becoming a bit more hesitant as rates push back toward 6.7%. Fewer new listings combined with steady sales activity means the pool of available homes is likely to keep thinning through the back half of the summer.
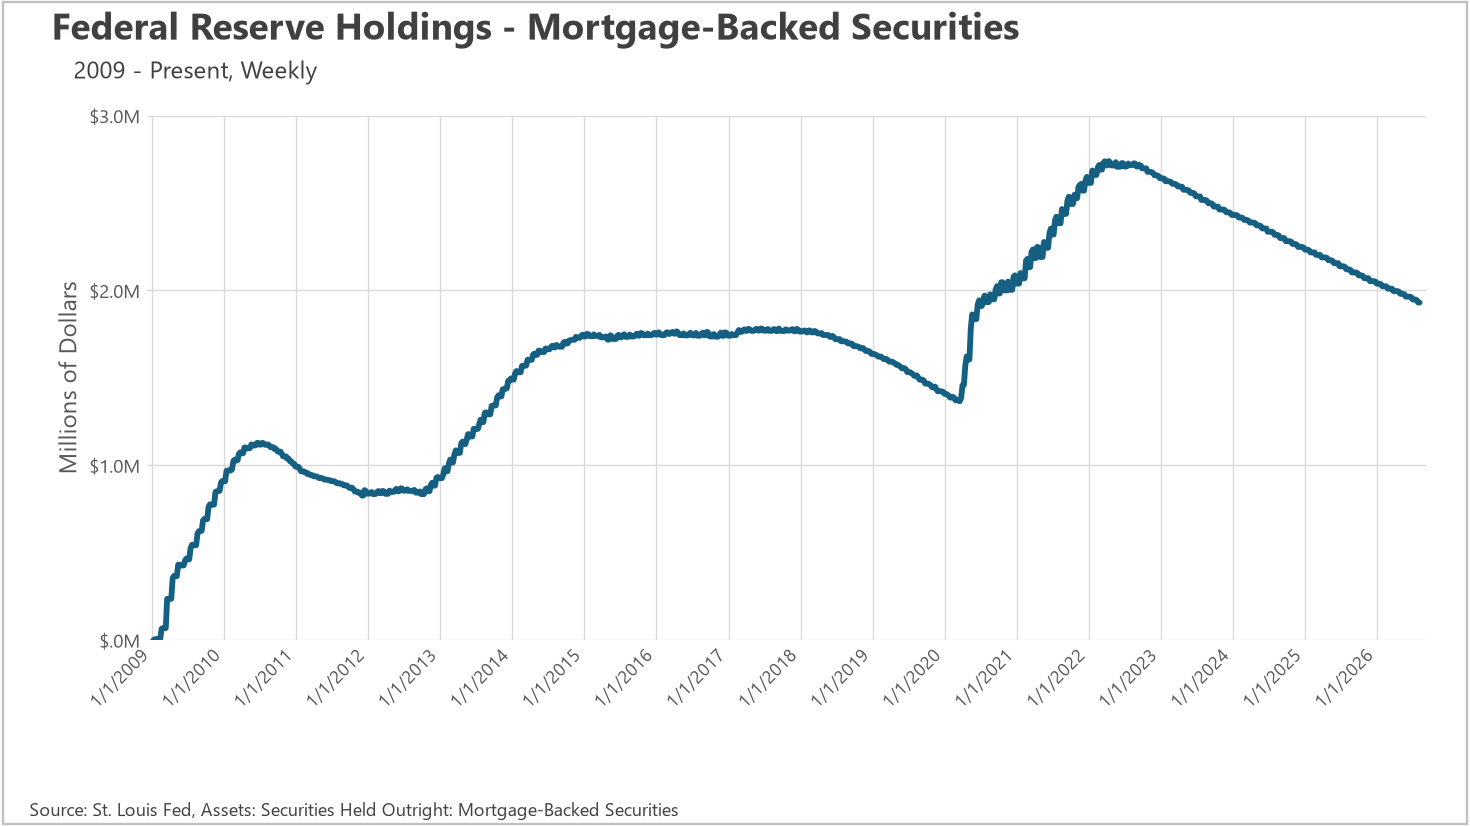
Existing home sales registered 4,060,000 in July, down 1.69% from June's 4,130,000 and roughly 3% below May's 4,190,000 high for the year. On a year-over-year basis, however, sales are up 0.74% from last July's 4,030,000, which means demand is essentially holding steady rather than deteriorating. That is a reasonable outcome given what buyers are facing. Monthly payments are back to where they were a year ago, and the run of price appreciation from January through June asked buyers to stretch further with every passing month. What is encouraging is that sales have stayed in a fairly narrow band between 4,010,000 and 4,190,000 all year, showing a market that has found a floor even as financing costs have moved around. Also worth watching in the background: the Federal Reserve's mortgage-backed securities holdings continue to shrink, falling to $1.93 trillion in August from nearly $2.07 trillion last November, which removes a source of support for mortgage rates over time.
When determining whether a market is a buyers’ market or a sellers’ market, we look to the Months of Supply Inventory (MSI) metric. The state of California has historically averaged around three months of MSI, so any area with at or around three months of MSI is considered a balanced market. Any market that has lower than three months of MSI is considered a seller’s market, whereas markets with more than three months of MSI are considered buyers’ markets.
Nationally, 1,540,000 homes for sale against a sales pace of 4,060,000 homes per year works out to roughly 4.5 months of supply, which puts the country as a whole comfortably in buyers' market territory by California's three-month yardstick. That said, the trend is moving in sellers' favor. A year ago the same math produced closer to 4.6 months, and with inventory down 1.91% month over month, new listings down 8.58%, and sales holding above last year's level, supply is tightening rather than loosening. The counterweight is affordability: with the median P&I payment back at year-ago levels and August rates at 6.69%, demand could soften enough to keep the balance where it is. As always, real estate is a highly localized asset, which is why you should check out what's going on in your local market below in the Local Lowdown!
Quick Take:
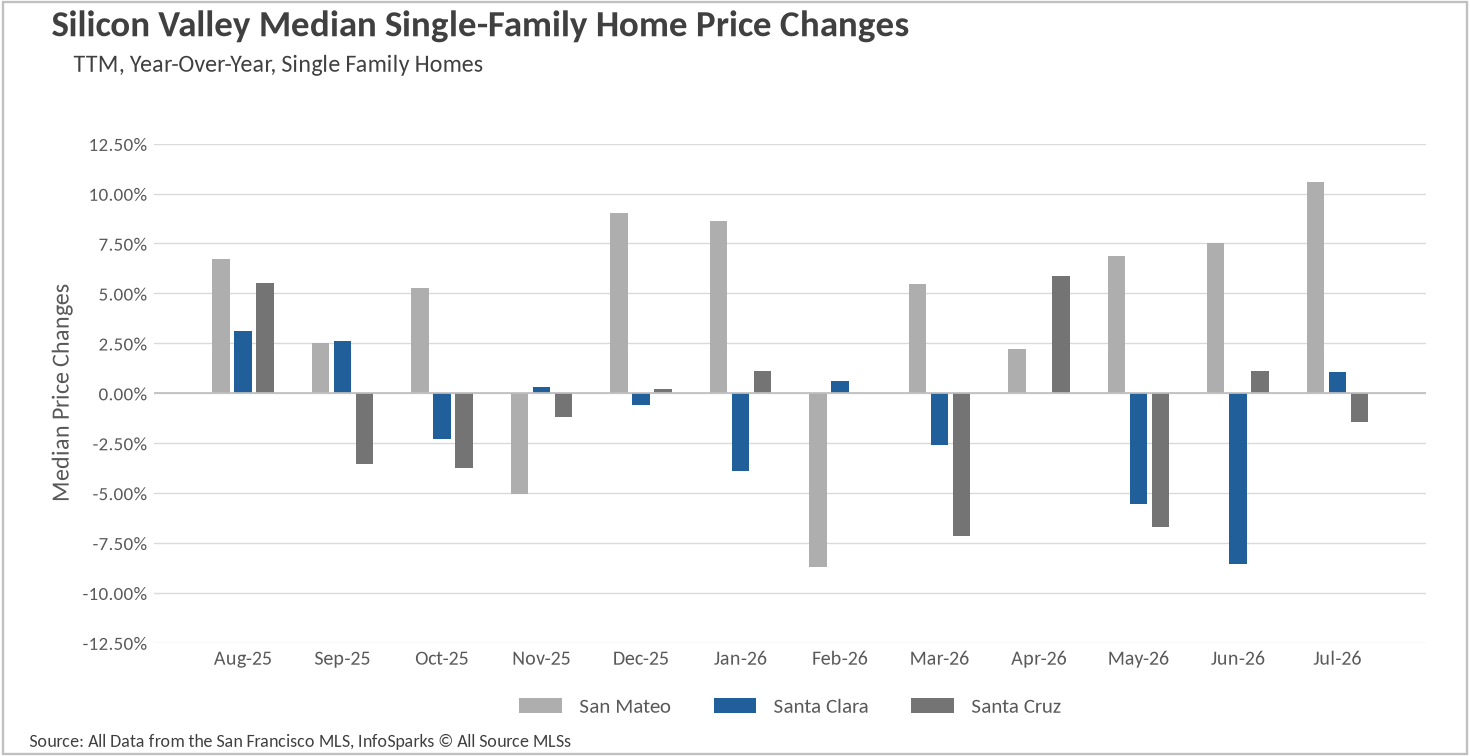
July brought a widening gap across the region, with San Mateo County single-family prices up more than 10% year over year while Santa Clara County held nearly flat and Santa Cruz County slipped slightly.
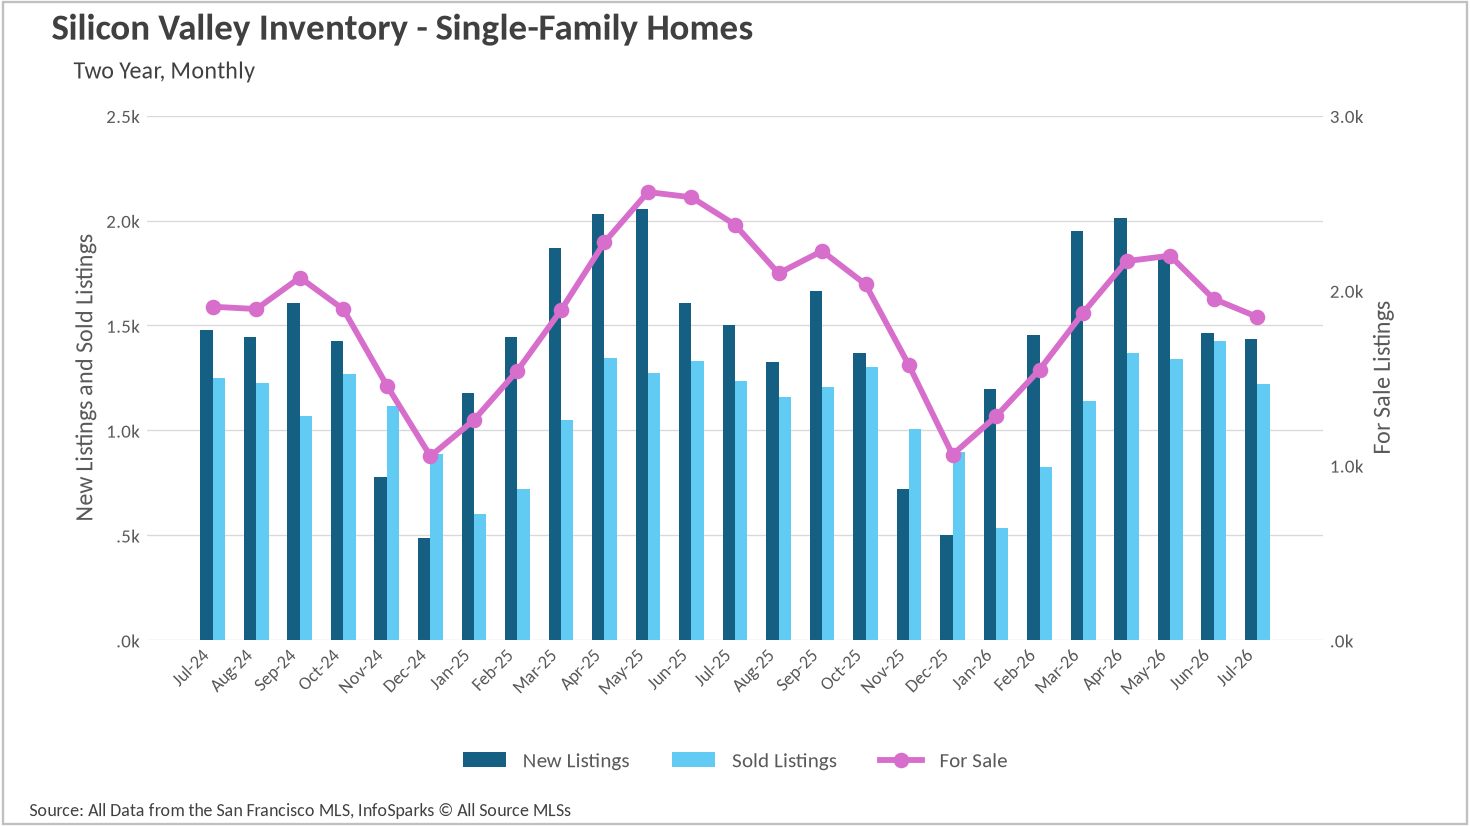
Inventory continues to tighten meaningfully, with 1,849 single-family homes for sale in July, down 22.18% from a year ago and off another 5.28% from June.
Single-family homes are still trading in about two weeks in San Mateo and Santa Clara Counties, though condo marketing times have stretched considerably, especially in Santa Cruz County.
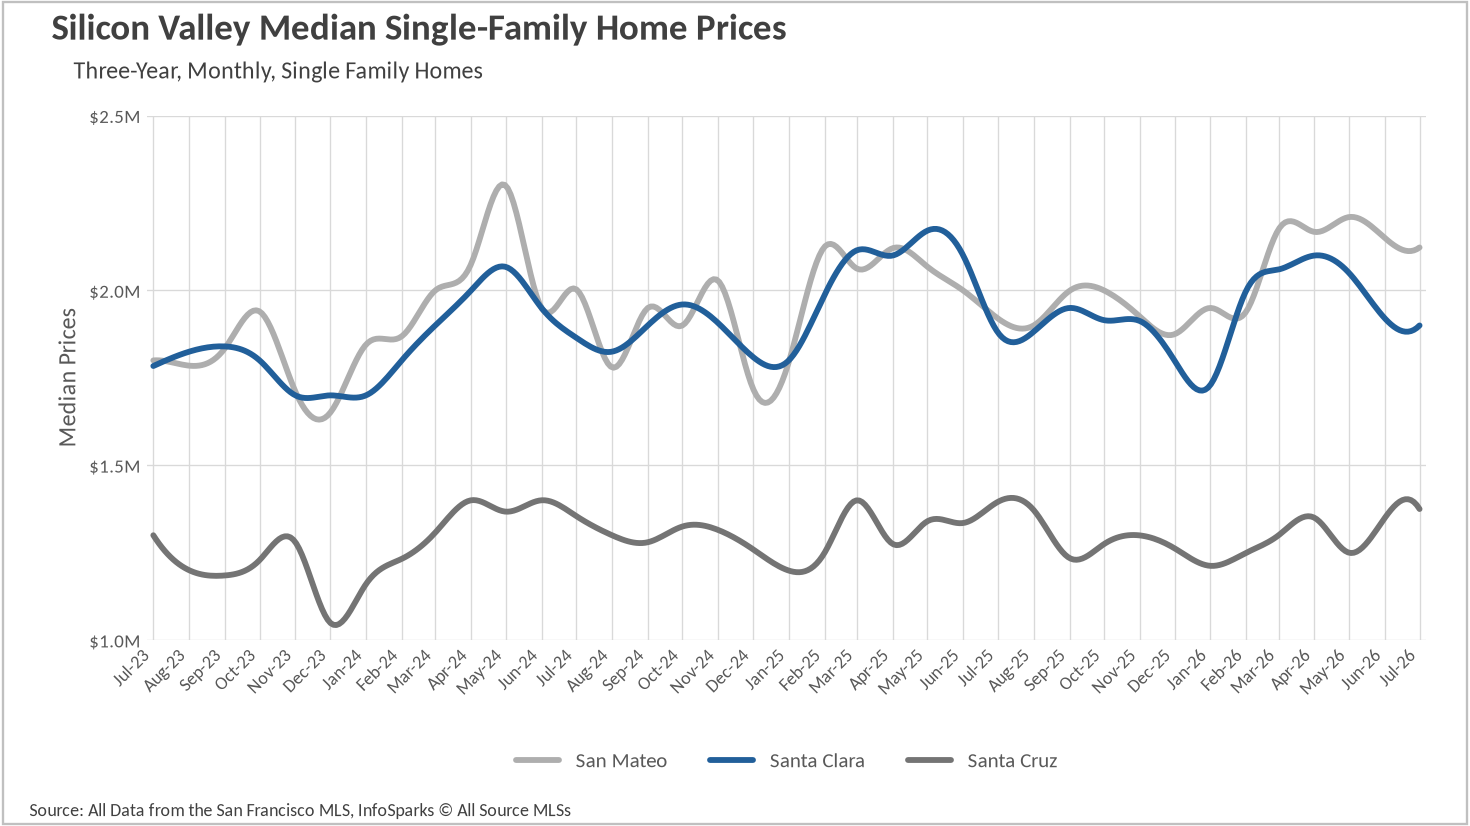
The single-family market in Silicon Valley continued its two-track story in July. San Mateo County led the region with a median sale price of $2,123,000, a 10.57% jump from the $1,920,000 recorded a year ago, even as the figure eased about 1.3% from June's $2,150,000. That modest monthly dip is typical seasonal cooling rather than a reversal, particularly given that San Mateo has now printed medians above $2.1 million in five of the last six months. Santa Clara County, by contrast, has flattened out. Its July median of $1,900,000 is up just 1.06% year over year and marks the third consecutive monthly decline from May's $2,050,000. Santa Cruz County landed at $1,375,000, down a slight 1.47% from last July but up 1.85% from June, continuing the choppy month-to-month pattern that has defined that county for the past year.
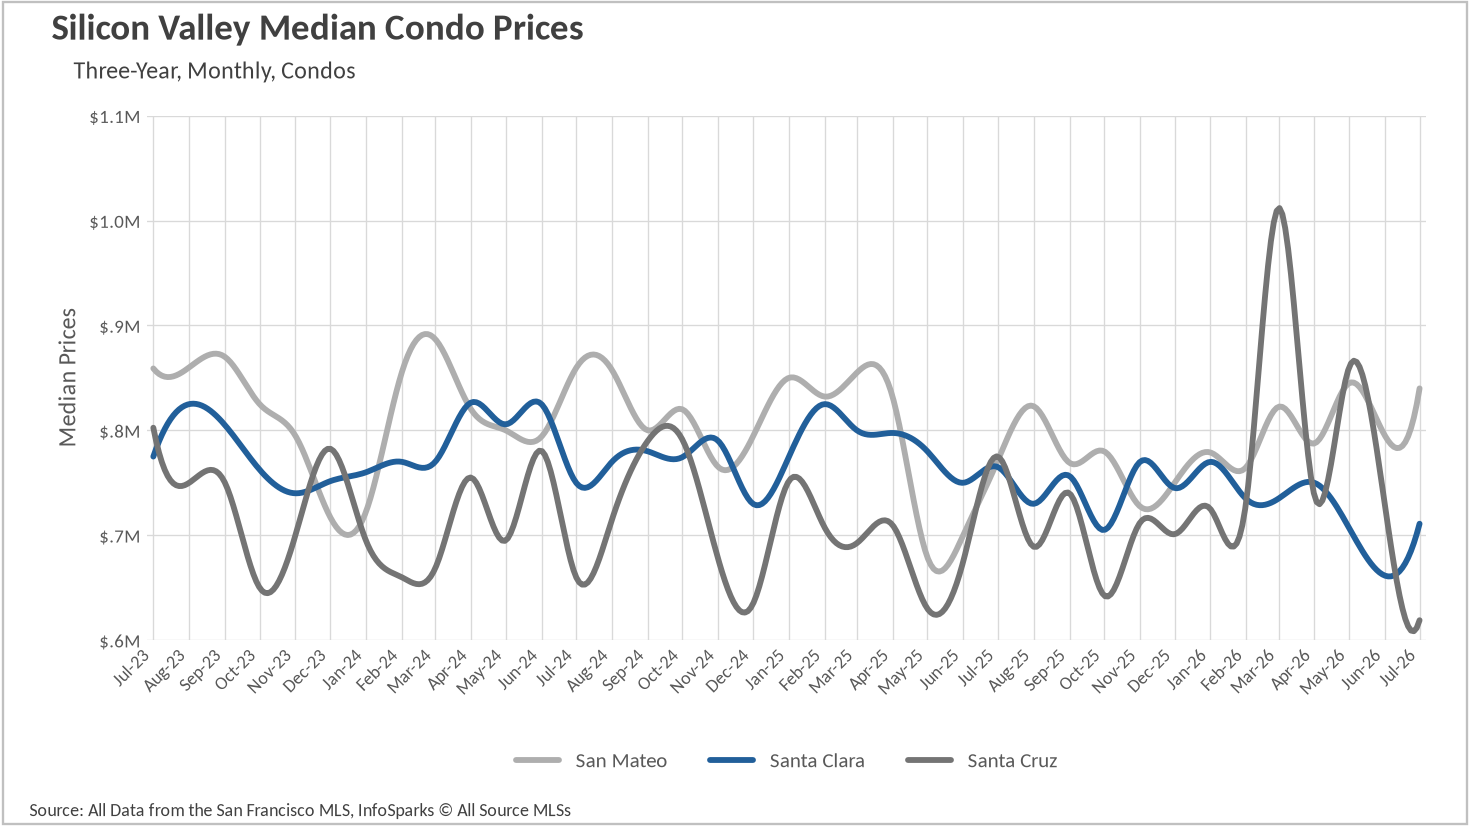
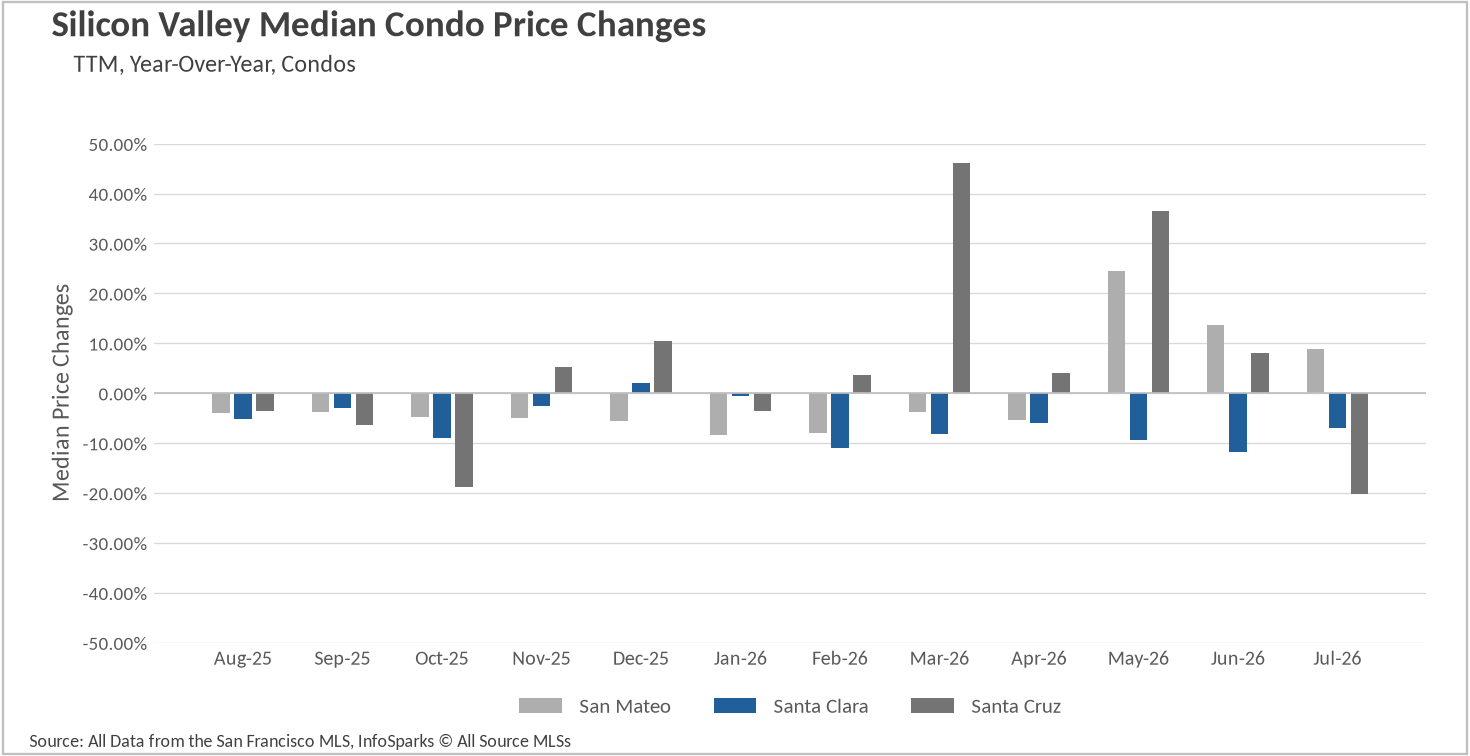
The condo picture was even more scattered. San Mateo County condos posted a median of $840,000, an 8.88% year-over-year gain and a 5.66% bounce from June, the strongest reading since early 2025. Santa Clara County condos recovered to $711,000 after June's $661,500 low, a healthy monthly rebound but still a 7.06% decline from last July. Santa Cruz County condos told the opposite story, falling to $619,000 from $728,750 in June, a 20.13% drop year over year. With such thin transaction counts in that segment, single-month swings should be read with caution, but the broader trend there has clearly softened.
Supply remains the defining feature of this market. There were 1,849 single-family homes for sale across Silicon Valley in July, down 22.18% from the 2,376 available last July and down another 5.28% from June's 1,952. That is the tightest July reading in the two-year record and continues the pattern of inventory peaking earlier and lower each spring. New listings came in at 1,434, off 4.59% year over year, while sold listings held essentially steady at 1,222 compared with 1,234 a year ago. In other words, demand has not fallen off, but sellers are simply not bringing as much product to market, and buyers are working through what does come available.
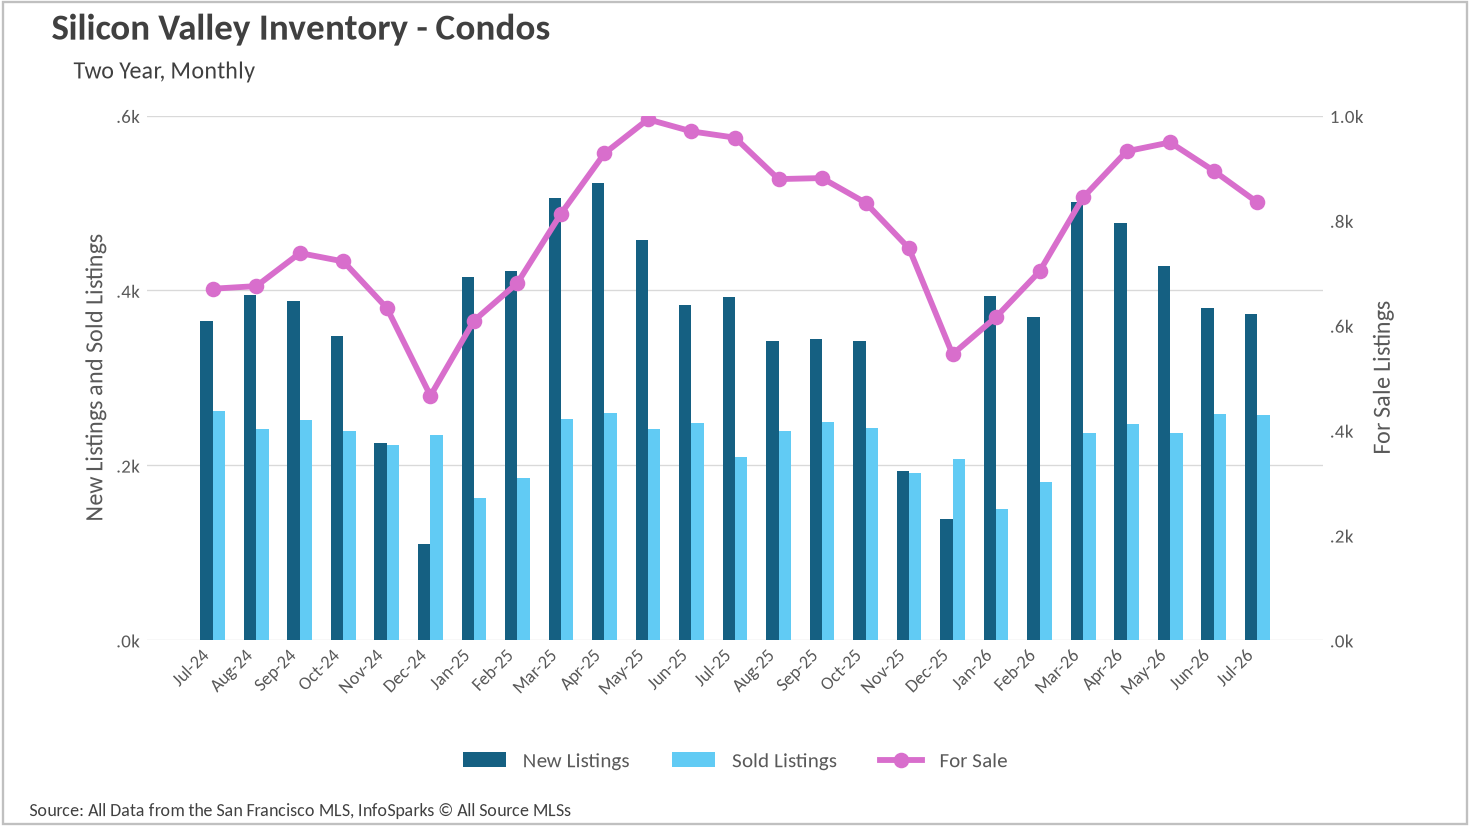
The condo market is following a similar path with a twist. There were 835 condos listed for sale in July, a 12.84% year-over-year decline and down from 895 in June. New condo listings slipped 4.85% to 373, but sold listings surged 23.44% to 258 from 209 a year ago. That combination of shrinking supply and stronger absorption is the most encouraging sign the condo segment has shown in months, and it helps explain the price rebounds in San Mateo and Santa Clara Counties.
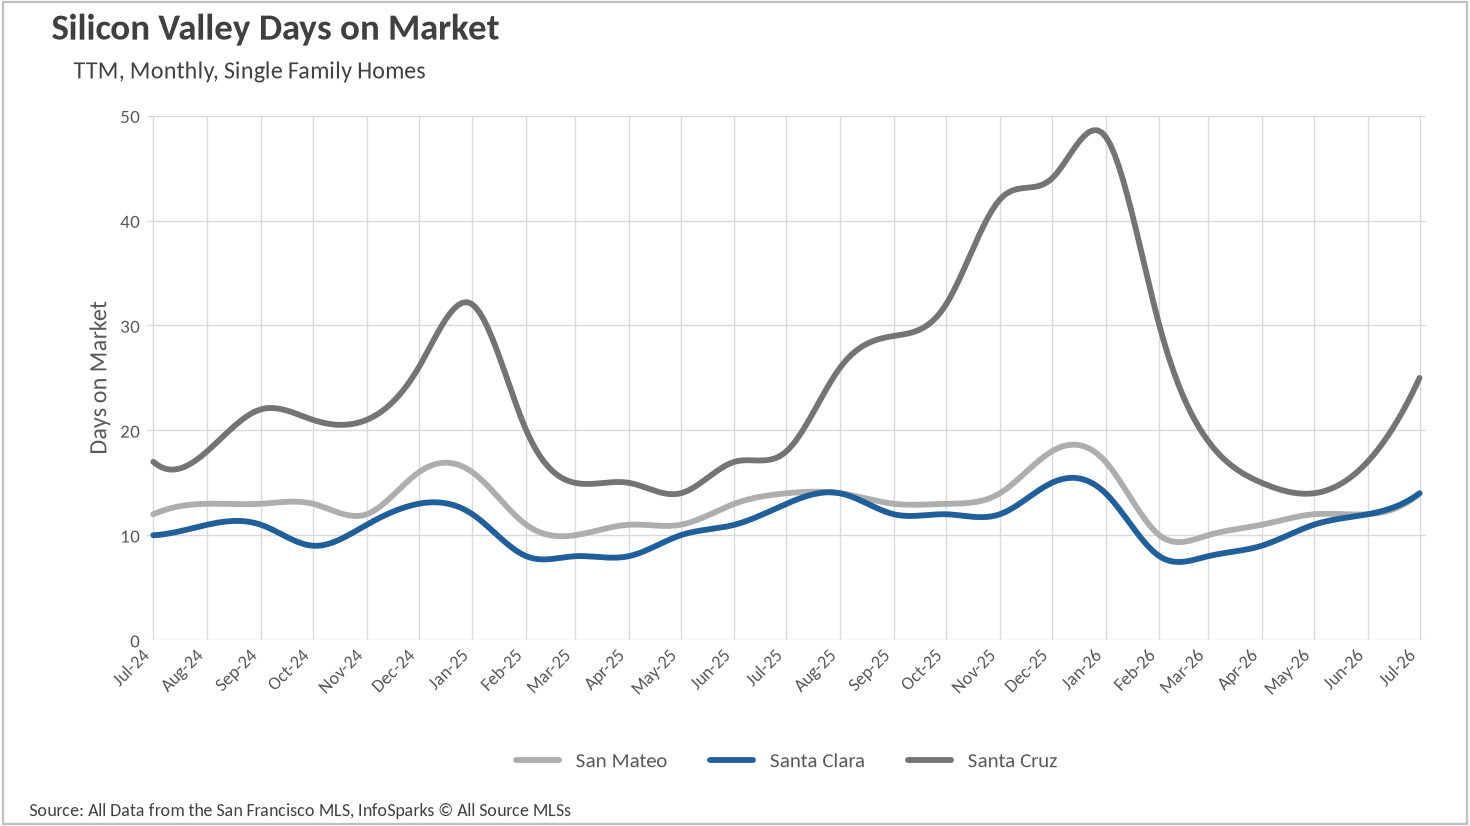
Speed of sale remains strong on the single-family side, though it is no longer accelerating. San Mateo County homes averaged 14 days on market in July, exactly matching last July, while Santa Clara County ticked up to 14 days from 13 a year ago, a 7.69% increase. Both counties have drifted up from their February and March lows of 10 and 8 days respectively, which is the normal summer rhythm. Santa Cruz County stands out, with homes averaging 25 days compared with 18 last July, a 38.89% increase and a sharp jump from June's 17 days.
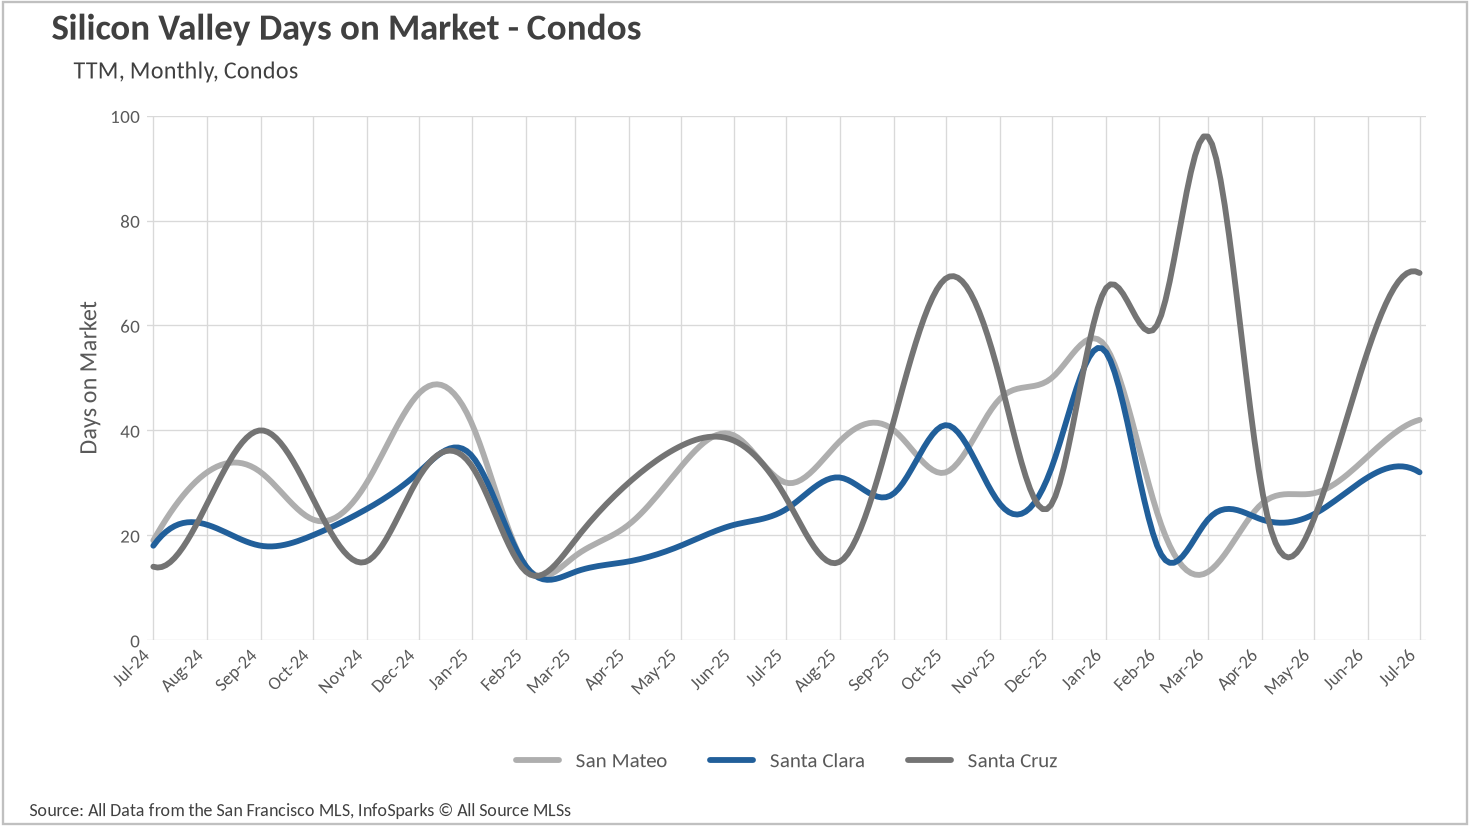
Condos are where patience is required. San Mateo County condos averaged 42 days on market, up 40% from 30 days last July, while Santa Clara County condos reached 32 days versus 25 a year ago, a 28% increase. Santa Cruz County condos are the clear outlier at 70 days, up from 27 last July, an increase of roughly 159%. Sellers in the attached-housing segment, particularly in Santa Cruz County, should plan for a substantially longer runway than their single-family counterparts and price accordingly from day one.
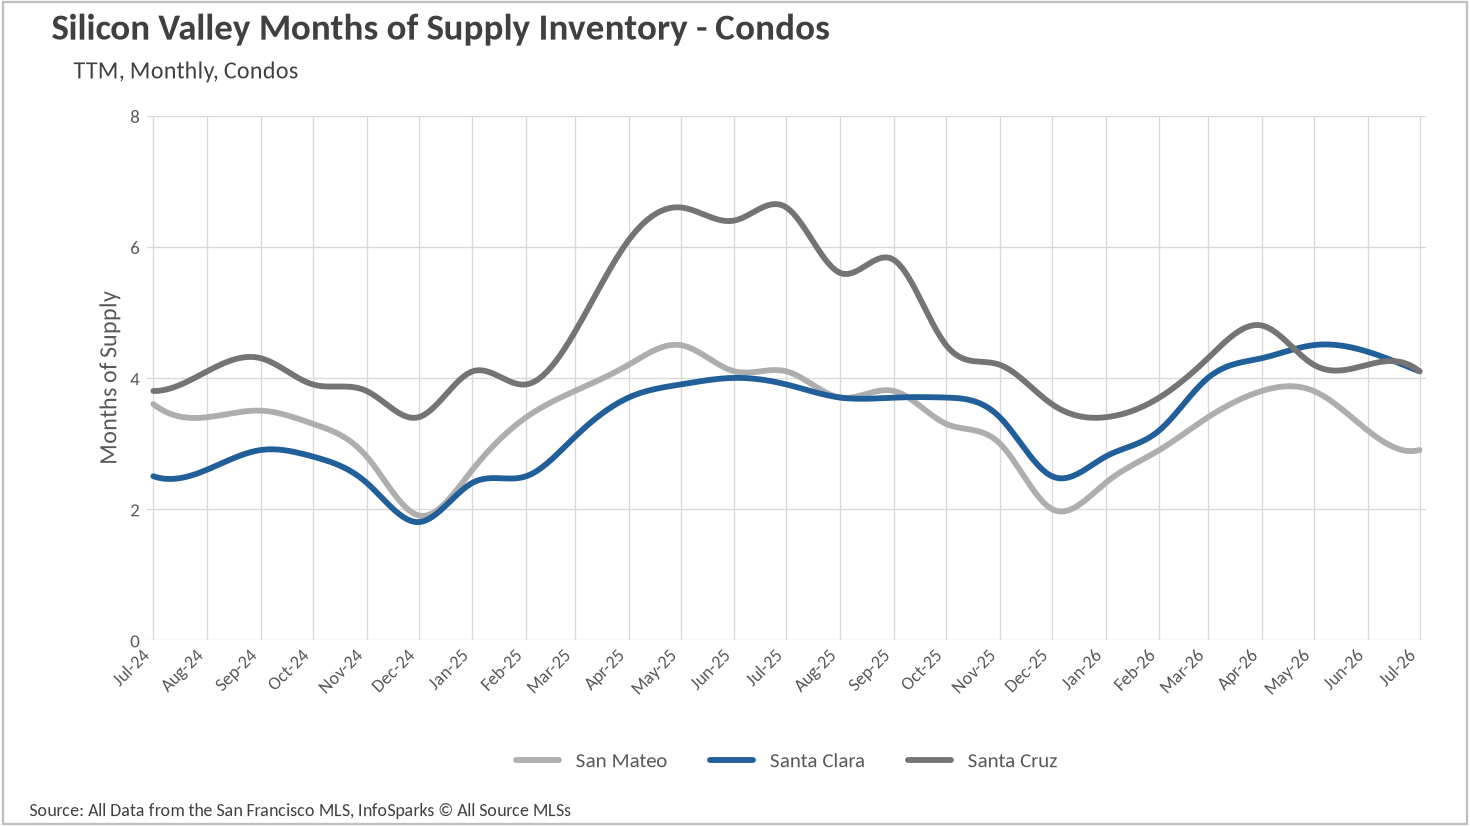
When determining whether a market is a buyers’ market or a sellers’ market, we look to the Months of Supply Inventory (MSI) metric. The state of California has historically averaged around three months of MSI, so any area with at or around three months of MSI is considered a balanced market. Any market that has lower than three months of MSI is considered a seller’s market, whereas markets with more than three months of MSI are considered buyers’ markets.
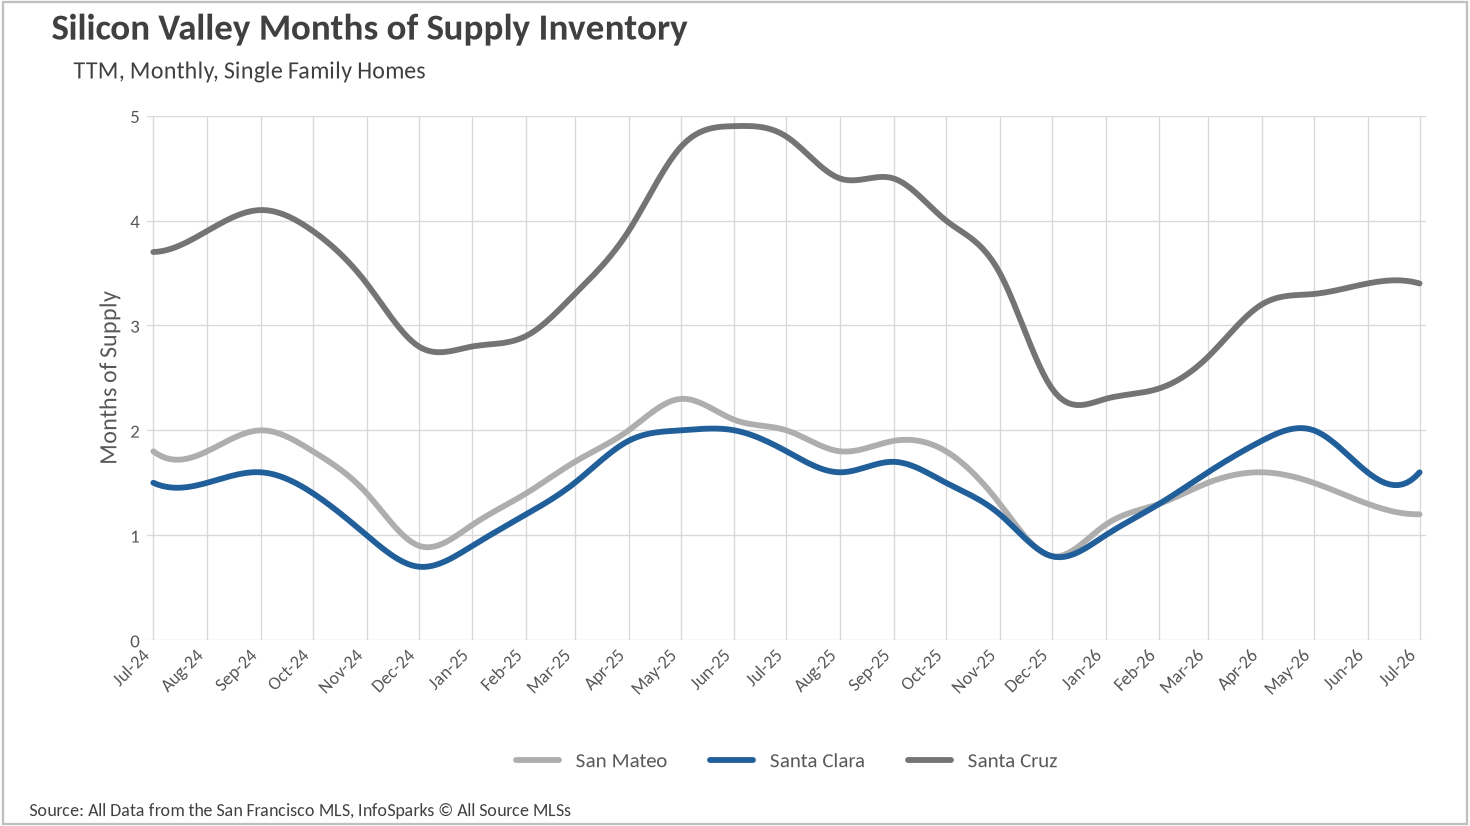
By that standard, the single-family market across Silicon Valley remains decisively in sellers' territory and has tightened further over the past year. San Mateo County sits at just 1.2 months of supply, down 40% from 2.0 months last July and the lowest July figure in the dataset. Santa Clara County holds at 1.6 months, down 11.11% year over year and unchanged from June. Santa Cruz County, historically the loosest of the three, has compressed to 3.4 months from 4.8 a year ago, a 29.17% decline that puts it right at the edge of balanced territory rather than the buyers' market it was last summer.
The condo segment offers a genuinely different experience. San Mateo County condos have tightened to 2.9 months of supply, down 29.27% from 4.1 last July and now technically in balanced-to-seller territory. Santa Clara County condos, however, sit at 4.1 months, up 5.13% year over year and the only measure in this report moving in buyers' favor. Santa Cruz County condos also register 4.1 months, though that is a substantial improvement from 6.6 months a year ago. The takeaway for July is straightforward: buyers pursuing a single-family home anywhere in the region should expect competition and come prepared, while those willing to consider a condo, especially in Santa Clara or Santa Cruz County, will find both more choice and more room to negotiate.
Stay up to date on the latest real estate trends.
Local Living | Midpeninsula | History
Market Update
Homeownership | Home Maintenance | Mid-peninsula

Real Estate 101 | Buying a Home | Midpeninsula

Real Estate 101 | Portola Valley
Real Estate 101 | San Carlos
We know that real estate transactions can be complex, but with our expertise, they don’t have to be stressful. Our team is dedicated to handling every aspect of your Mid-Peninsula real estate needs with the utmost care and professionalism. From the initial consultation to the closing, we manage all the details so you can focus on your future. Whatever challenges arise, trust that we’ve got this — your success is our top priority.